Discount #06 — The Signal Worth Tracking: Cash Flow Quality and What It Predicts
Of SASAC's six "One Profit, Five Ratios" metrics, only two cleanly predict stock returns: operating cash ratio and ROE above 10%. We walk through what the backtest data shows—and build a Buffett-style screening discipline North American investors can apply today.

A Buffett Frame, Applied to Beijing
Warren Buffett spent six decades teaching North American investors a single durable principle: earnings can be engineered, cash cannot. Revenue recognition is a judgment, depreciation is a schedule, working capital is a lever, and the income statement is, in his characterization, "an opinion." The cash flow statement, by contrast, "is a fact."
This principle travels well. It travels particularly well to environments where governance opacity is high, where minority shareholders have limited recourse, and where accounting standards leave more room for management discretion than U.S. GAAP. China's central state-owned enterprises operate in exactly such an environment. The earlier installments in this series established that the SOE discount is real, that it prices governance uncertainty, and that the 2023 reform framework changed incentives without removing structural risk. What the prior installments did not address is the practical question: which signal, among the metrics that SOEs disclose, actually predicts share-price performance?
This installment answers that question. The data, surprisingly, points to a single dominant signal — and it is the same signal Buffett has been pointing at for sixty years.
The Six Metrics, Tested Against Returns
The 2023 "One Profit, Five Ratios" framework defines the six indicators by which SASAC now evaluates central SOE management: total profit, return on assets (asset-liability ratio), return on equity, R&D intensity, total labor productivity, and operating cash ratio. Each indicator has a policy intention. Each also produces a different empirical relationship with share-price returns when SOEs are sorted into terciles and tested historically.
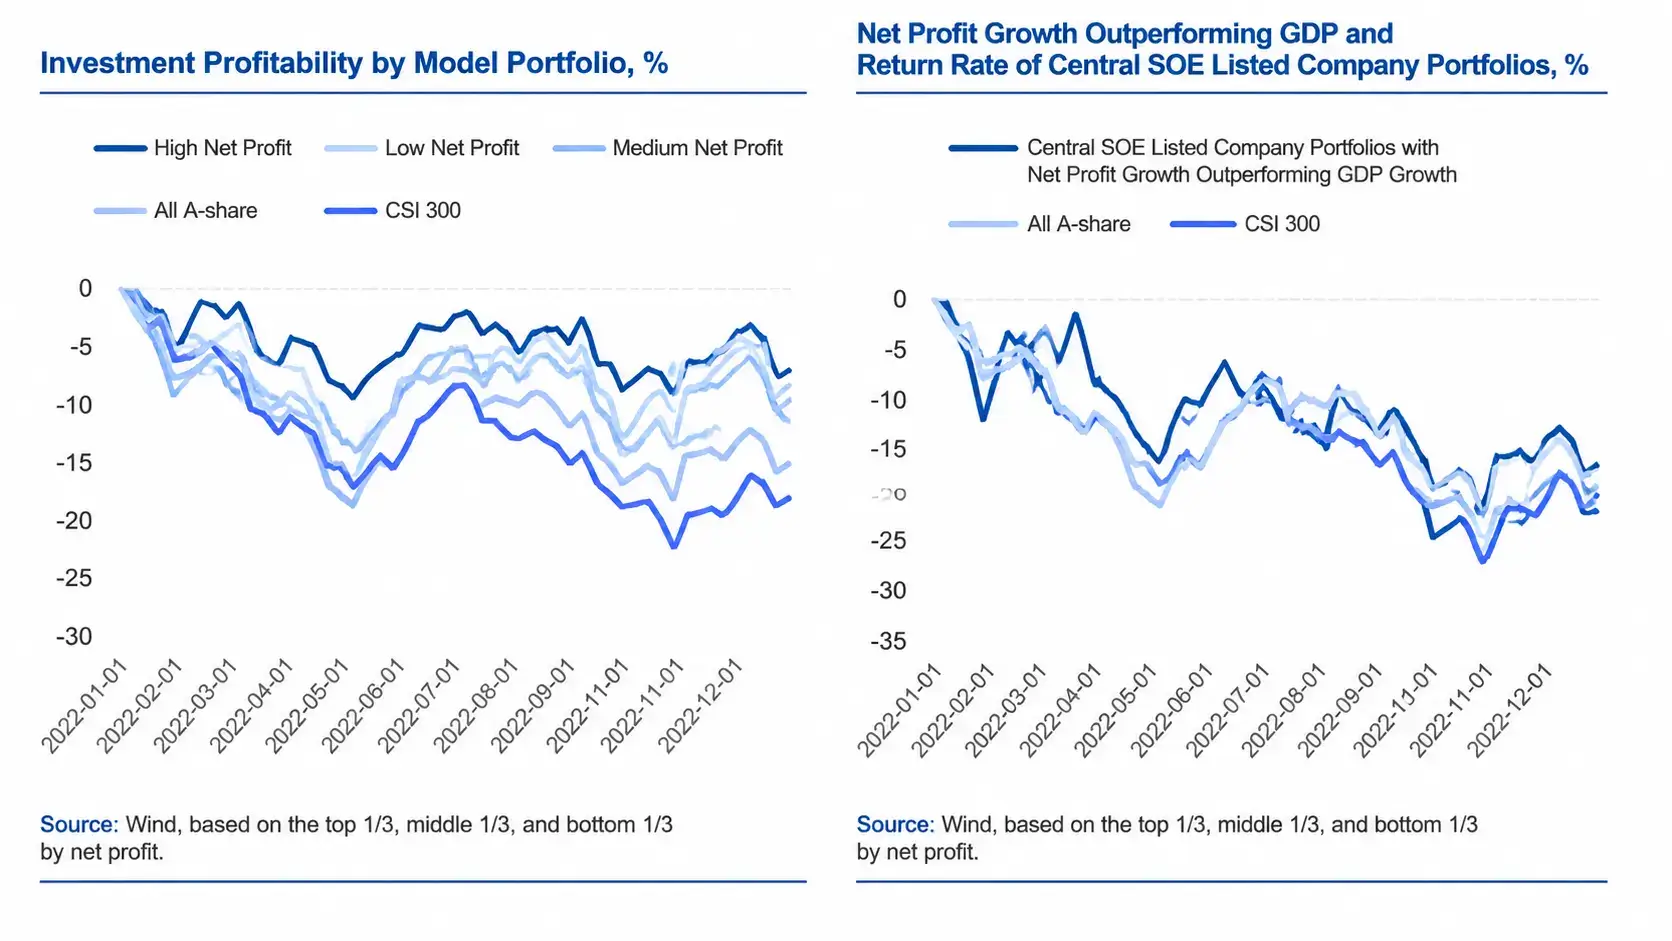
The Orient Securities research backtested all six metrics, sorting central SOEs into top, middle, and bottom thirds on each indicator and comparing returns against the CSI 300 and the broader A-share market. The pattern across the six is not what one would expect from policy framing alone.
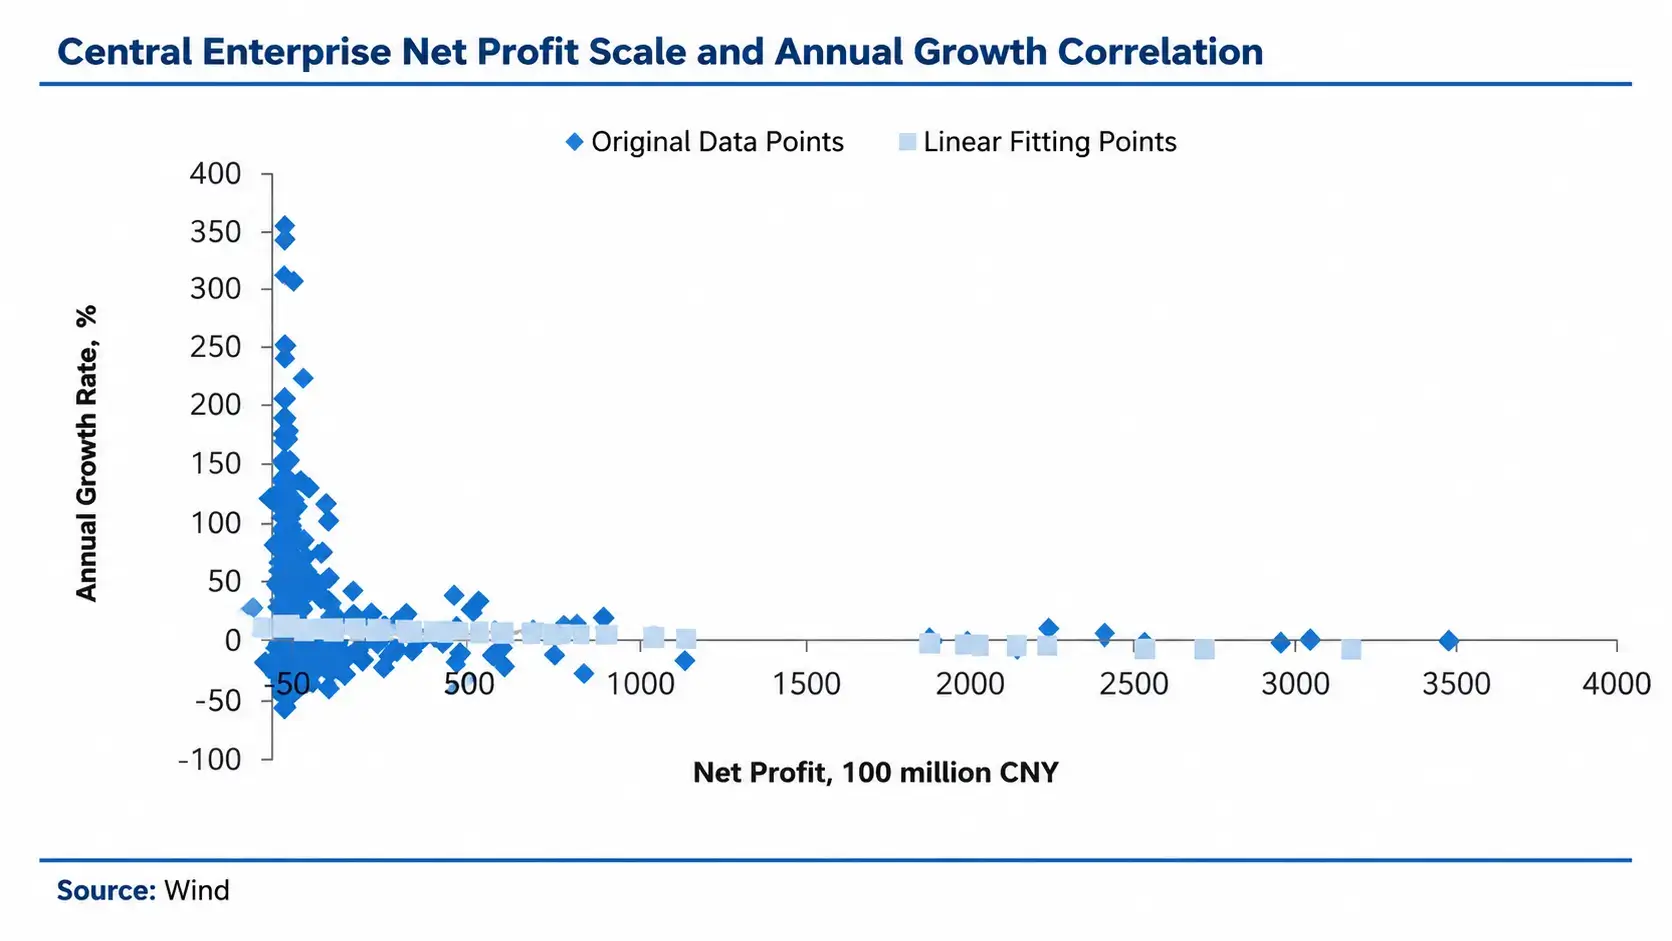
Net profit scale. The intuitive expectation — that larger and faster-growing profits drive returns — is not what the data shows. While high-net-profit portfolios outperform in down markets (showing defensive characteristics), the linear correlation between net profit scale and annual returns is essentially zero. The research explicitly concludes that net profit size "can only serve as a reference for allocation and cannot, for now, be used as a basis for generating returns." This is the first warning sign that the headline metric most North American analysts default to is the least useful within the central SOE universe.
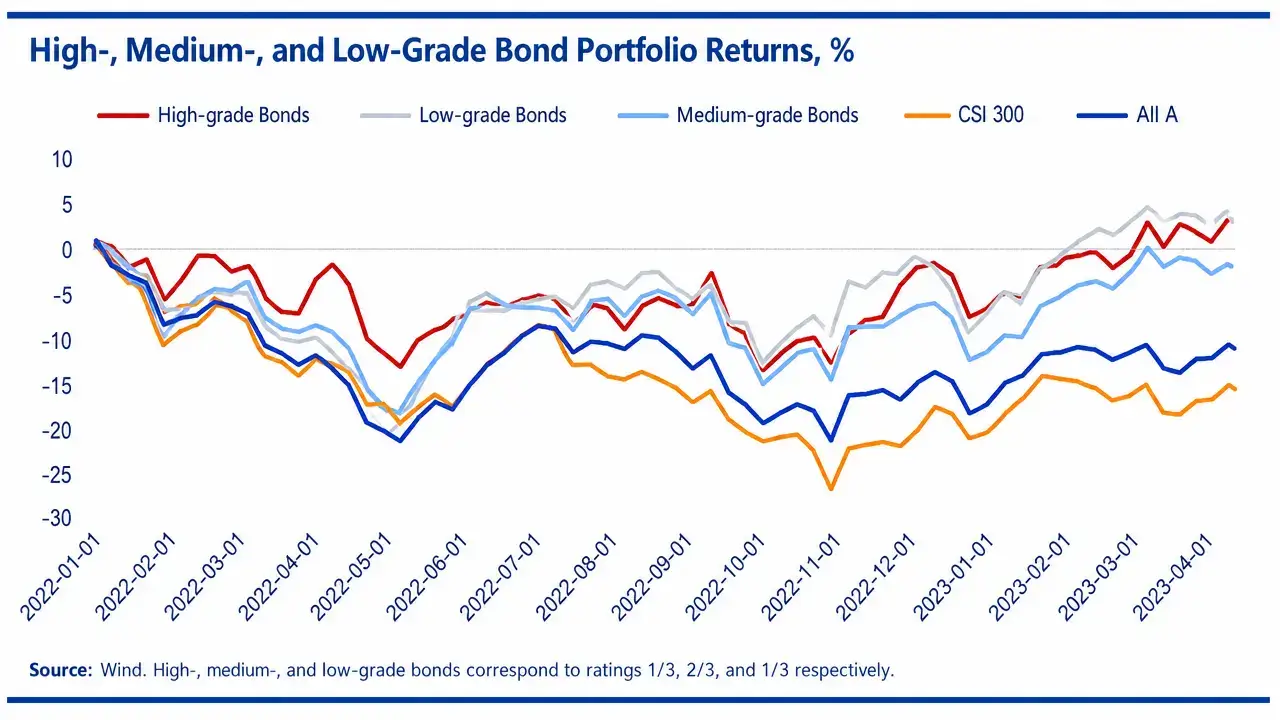
Leverage ratio. The pattern flips midway through 2022. In the first half, high-leverage portfolios outperformed. From Q3 2022 onward — coinciding with the early policy signals that would become the formal "One Profit, Five Ratios" framework — low-leverage portfolios systematically outperformed. The market began rewarding balance-sheet discipline as soon as policy began enforcing it.
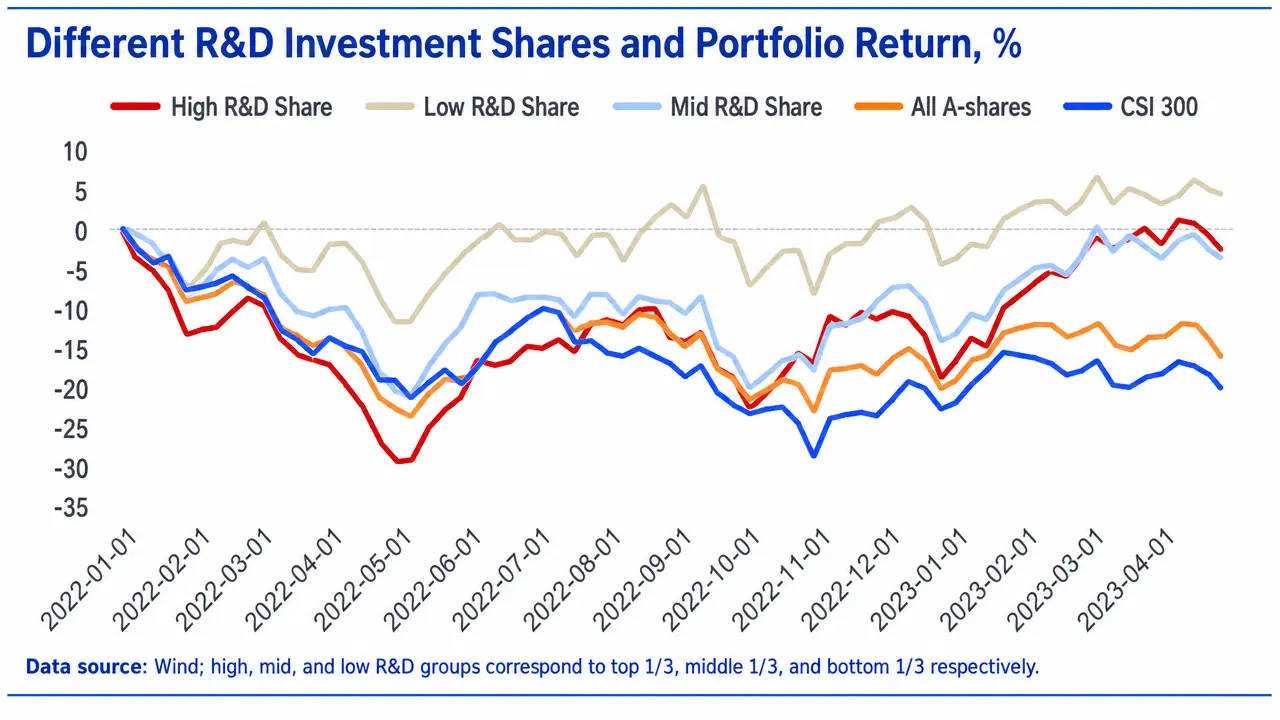
R&D intensity. This is the most counterintuitive result in the entire dataset. Low-R&D-intensity portfolios have systematically outperformed high-R&D-intensity portfolios since the start of 2022. This is not, as some readings would suggest, evidence that the market dislikes innovation. The more careful interpretation, offered in the underlying research, is that R&D spending in the short term has not yet translated into earnings, and the market discounts spending whose payoff cannot be immediately verified. Investors are not rejecting innovation — they are refusing to credit it before it shows up in the cash account.
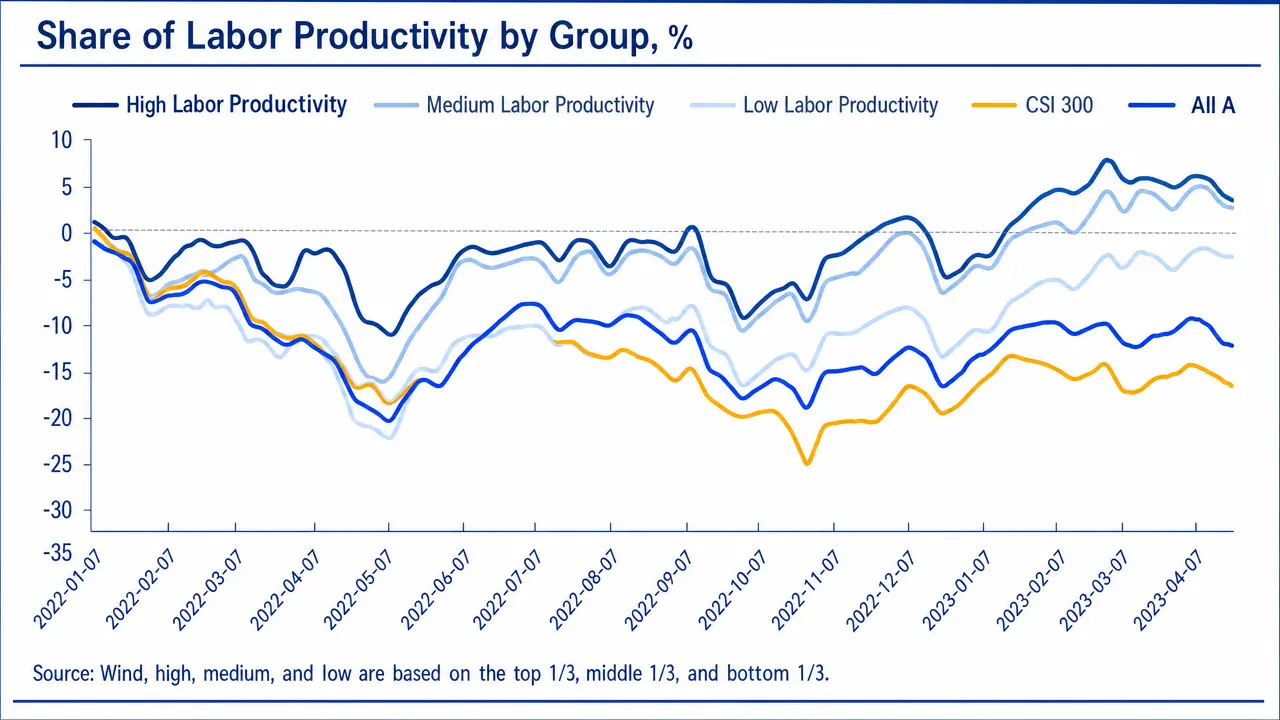
Labor productivity . A pattern similar to R&D. Low-productivity portfolios have outperformed since November 2022. The research interprets this as the market pricing the optionality on workforce optimization — investors expect low-productivity SOEs to improve under reform pressure, while already-high-productivity SOEs have less room for incremental improvement.
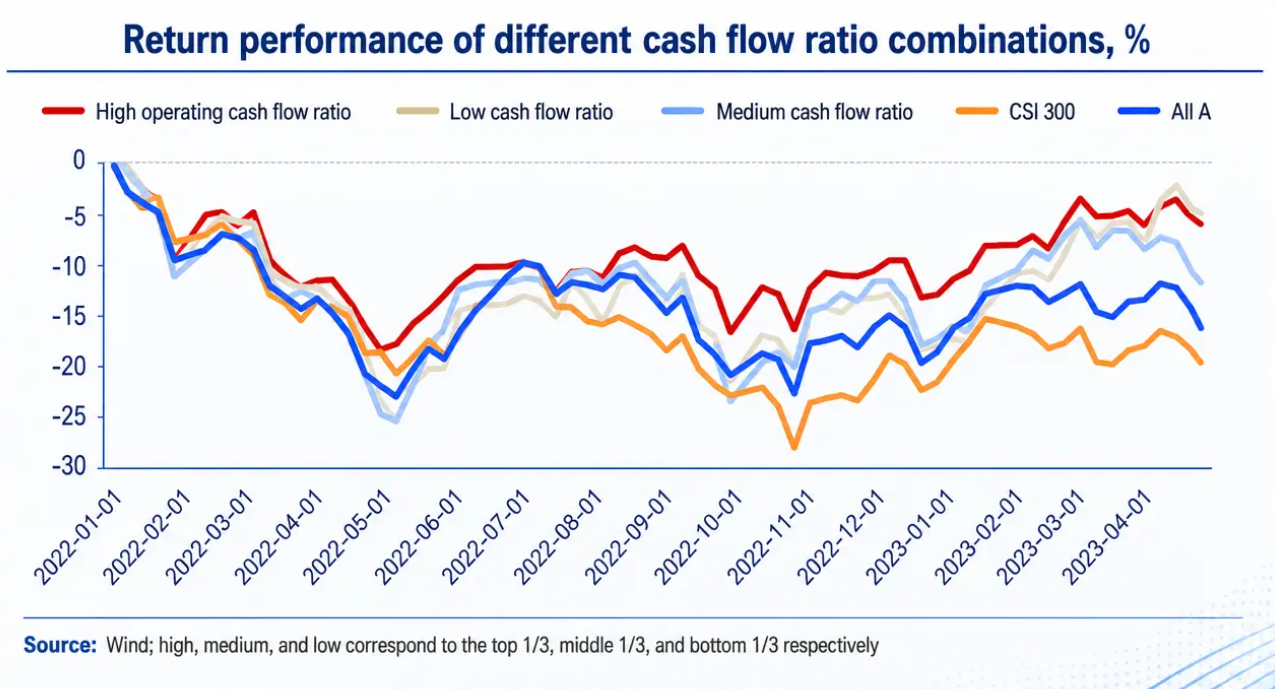
Operating cash ratio. Here the pattern is clean and consistent. Since the start of 2022, the high-operating-cash-ratio tercile has systematically outperformed both the middle and bottom terciles, as well as the CSI 300 and the broader A-share market. The research explicitly notes that "in stock selection, the operating cash ratio can serve as one of the reference indicators." This is the strongest individual empirical finding in the entire back test.
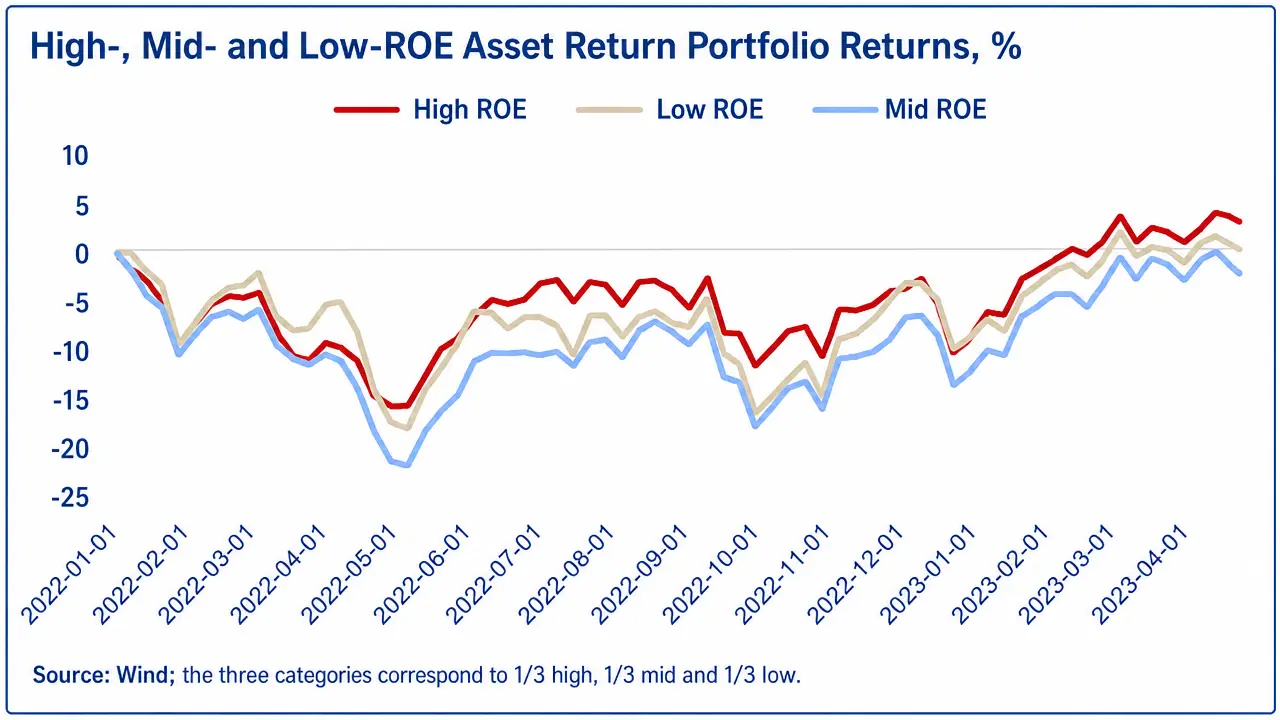
Return on equity. Also a clean signal. High-ROE portfolios have meaningfully outperformed middle and bottom ROE terciles over the past twelve months. ROE works — but only at the headline level, and only when combined with quality verification.
Why Cash Flow Is the Dominant Signal
Across six indicators, two emerge as cleanly predictive: operating cash ratio and ROE. Of the two, operating cash ratio is the more analytically robust for three reasons.
First, denominator stability. ROE can be manipulated through buybacks, asset write-downs, balance sheet reorganization, and segment reclassification. The denominator of operating cash ratio is operating revenue — a figure subject to substantial external scrutiny and difficult to inflate without leaving traces in receivables or inventory.
Second, multi-period coherence. A single quarter of weak operating cash flow alongside strong reported earnings can reflect legitimate working capital expansion. The same gap sustained over four consecutive quarters is almost certainly evidence of realization deterioration. The signal sharpens with time horizon, which is precisely what long-term investors should want from a quality screen.
Third, alignment with dividend mechanics. Central SOEs that distribute a high share of net profit as dividends must have the cash to do so. A firm reporting high ROE without commensurate operating cash flow cannot sustain a high payout ratio without external financing — which the reform framework's emphasis on stable leverage explicitly discourages. The metric is reinforced by every other policy lever in the system.
The convergence of these three properties is what Buffett has been pointing at since the early Buffett Partnership letters. In an environment where management discretion is high and external scrutiny of accruals is limited, cash flow is the verification mechanism that minority shareholders can independently confirm. Every other metric requires trust in management or auditors. Cash flow requires only that the bank balance moved.
The R&D Paradox, Read Correctly
The R&D finding deserves a closer look, because it is the one result in the backtest that risks being misread.
A surface reading suggests the market is hostile to innovation — that Chinese SOEs are being penalized for spending on R&D. This reading is wrong, and it would lead North American allocators in particular to misjudge the signal.
The correct reading is that the market applies a verification standard to claimed innovation. R&D expense, like depreciation, is a judgment call. SOEs can capitalize or expense, can categorize broadly or narrowly, can report intensity figures that the firm itself defines. Until R&D translates into either patent productivity, revenue from new products, or measurable operating cash flow improvement, the market refuses to credit it. The discount on high-R&D portfolios is not an anti-innovation signal. It is a pro-verification signal.
This is consistent with the cash flow result. Both findings point to the same underlying principle: the market is willing to reward demonstrated quality, but it is unwilling to pre-pay for claimed quality. The reform framework introduced six metrics. The market is reading only two of them with credibility.
What This Means for Screening
The practical implication for North American investors is a two-dimensional screening discipline.
The first dimension is operating cash ratio in the top tercile of the central SOE universe. This is the cleanest empirical predictor of forward returns in the backtest, and it is also the metric Buffett's logic identifies as the hardest to engineer. A firm passing this screen has demonstrated that its reported revenue translates into cash within the same reporting period.
The second dimension is ROE above 10%. The PB-ROE framework discussed in Part IV breaks down on central SOEs, but the underlying logic of ROE-as-capital-efficiency-signal still operates within the cohort. Firms producing sustained double-digit ROE have demonstrated that they can generate returns on shareholder capital at a rate competitive with global industrial benchmarks. Below 10% ROE, the discount the market applies appears to be appropriate. Above 10%, the discount becomes increasingly difficult to justify on fundamental grounds.
The intersection of these two conditions — high operating cash ratio and ROE above 10% — produces a substantially narrower universe than either screen alone. It is the first concrete, replicable filter this series has offered. Firms passing both conditions are not automatically investable. They are, however, the universe within which deeper research is most likely to identify mispricing.
This is the screening discipline a North American allocator can implement today, using publicly disclosed Chinese SOE financial data, without requiring on-the-ground research or Chinese-language fluency. It is the bridge between the analytical framework the prior five installments built and the named cohort the next two installments will introduce.