Discount #05 — Industry Map: Where the Discount Is Largest, and What That Reveals
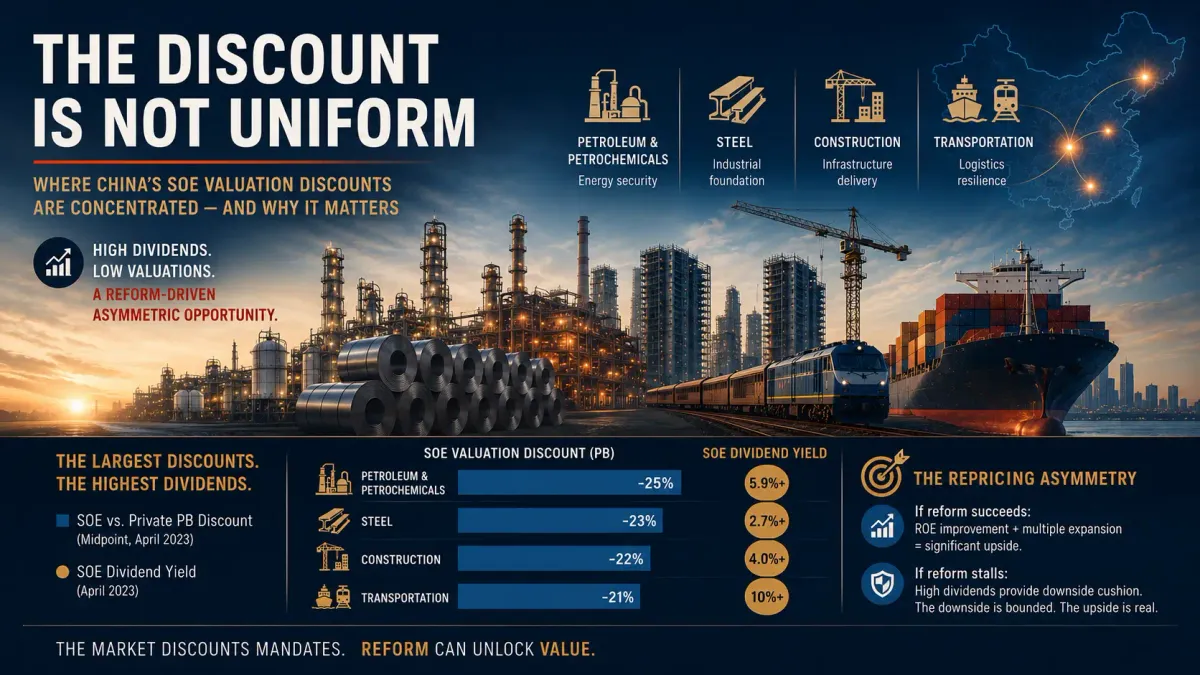
Four Chinese SOE industries trade at PB discounts above 20% versus private peers: petrochemicals, steel, construction, and transportation — also the highest-yielding sectors. This installment maps where the discount concentrates and what the geography reveals about policy-mandate pricing.

The Discount Is Not Uniform
The four prior installments of this series established that China's central SOEs trade at a structural discount, that the 2023 reform framework changed management incentives without removing structural risk, that higher dividends have not closed the valuation gap, and that what the market is actually pricing is governance uncertainty rather than fundamental weakness.
This installment moves from the aggregate to the specific. The SOE discount is not distributed evenly across the Chinese equity market. It concentrates — and the geography of where it concentrates is itself a signal. The industries with the largest discounts share a common feature: they are precisely the industries where the tension between policy mandate and shareholder return is most acute. Read correctly, the industry map is a map of where the state has historically asked SOEs to do things that private firms would not do, and where the market has consequently refused to extend full credit to reported earnings.
Four Industries, One Pattern
According to the underlying research from Orient Securities (April 2023), four industries show SOE-versus-private valuation discounts exceeding 20% on a price-to-book basis: petroleum and petrochemicals, steel, construction, and transportation. These four industries are not a random selection. They are heavy, capital-intensive, often cyclical, and in every case they are sectors where the state has retained operational dominance for reasons that go beyond commercial logic — energy security, supply chain control, infrastructure delivery, and logistics resilience.
What is striking is that the same four industries also produce the highest dividend yields among Chinese SOEs. The discount is largest precisely where cash returns are most stable. This is the inverse of what would be expected in a normally functioning equity market, where lower valuations would typically reflect either deteriorating fundamentals or unsustainable payouts. Neither condition holds here. The discount is real, the dividends are real, and the gap between them is what defines the opportunity — and the risk — for non-Chinese investors.
Steel: Cyclical Industry, Structural Discount
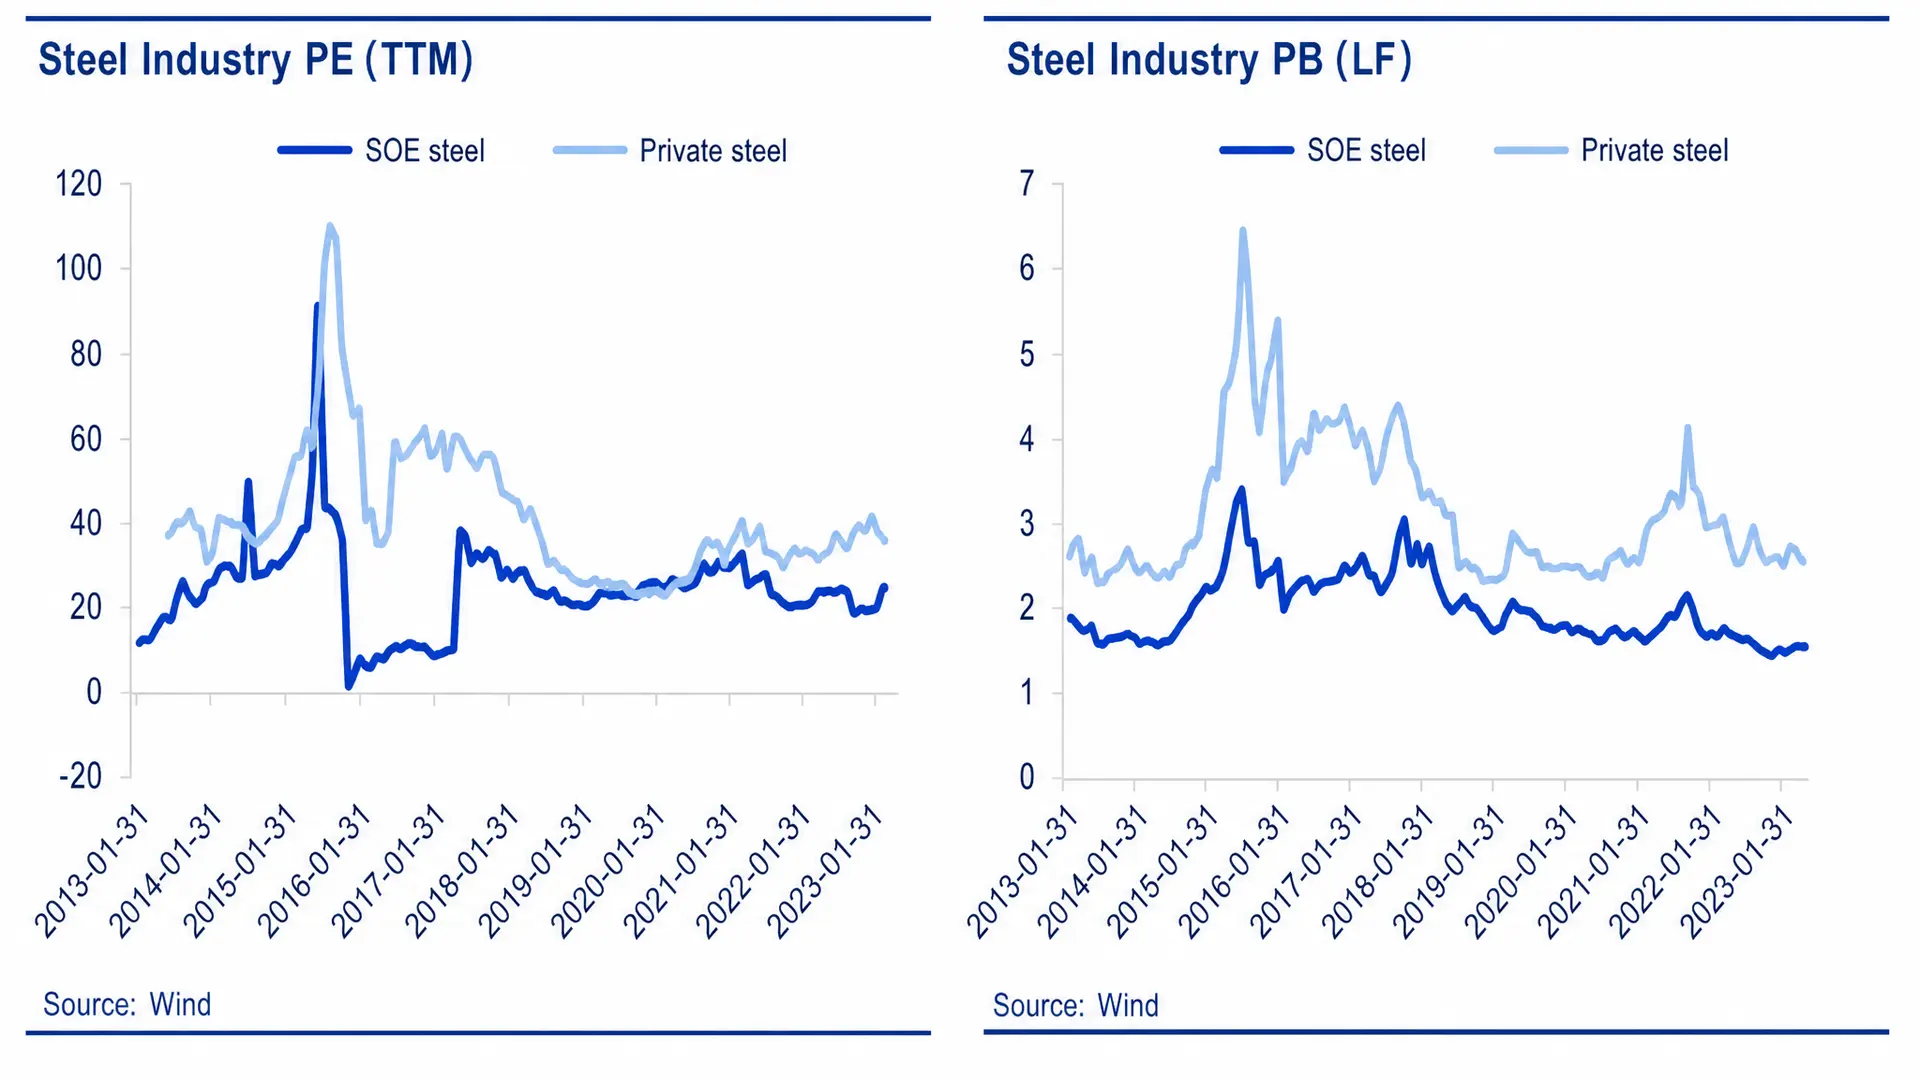
Steel sits in the middle of China's "black" industrial chain, with upstream exposure to coal and iron ore and downstream exposure to real estate, infrastructure, automotive, and machinery. It is inherently cyclical, and the supply-side reforms of 2015–2018 consolidated the industry around state-owned producers, improving margins and reducing competitive pressure. SOE steel producers were the primary beneficiaries.
Yet the valuation outcome contradicts the operational improvement. The PB midpoint for SOE steel producers has remained below 1.5x for the past five years, and has trended downward since 2019. Private-sector steel producers trade at higher multiples despite lower scale and inferior cost positions.
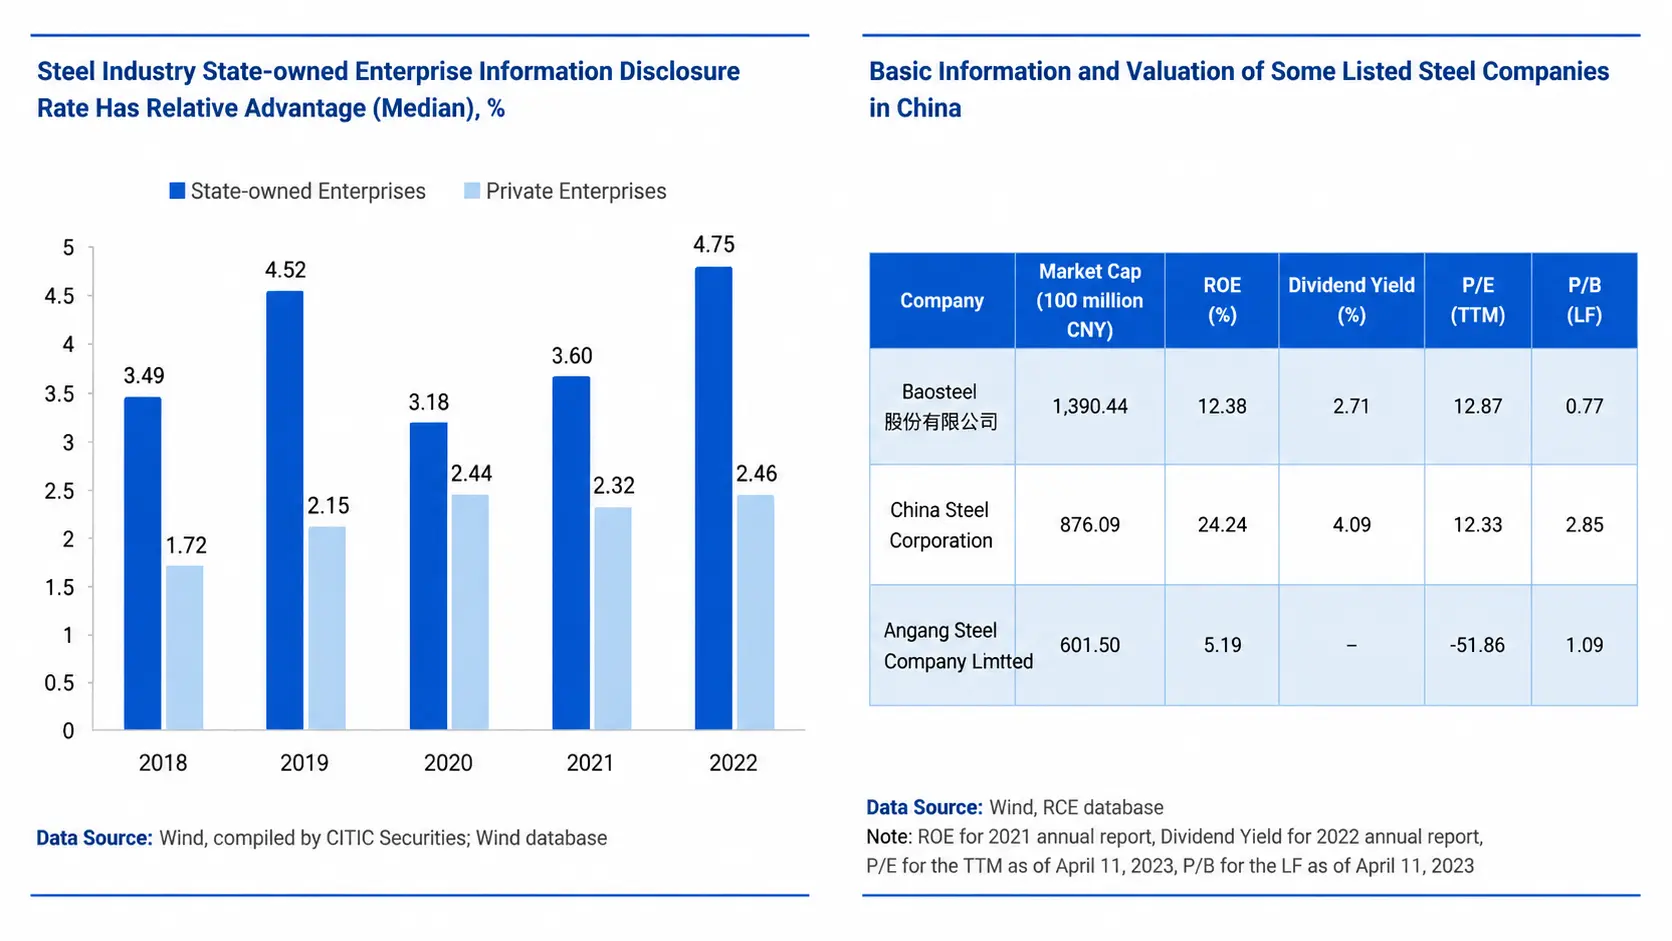
The Baoshan Iron & Steel (Baosteel, 600019.SH) case illustrates the anomaly with unusual clarity. As of April 2023, Baosteel reported a 2021 ROE of 12.38%, a dividend yield of 2.71%, and traded at a PB of 0.77x. In any North American industrial context, a producer with double-digit ROE, a near-3% yield, and a sub-1x book multiple would be a contested takeover target or a value-fund anchor position. In Chinese steel it is unremarkable. Citic Pacific Special Steel (CITIC Special Steel, 000708.SZ), which combines an SOE parent with more market-driven operations, trades at PB 2.45x on ROE 24.24% — closer to what a normal market would assign Baosteel. The gap between these two valuations within the same industry is not explained by fundamentals. It is explained by how the market discounts producers whose capacity decisions remain subject to policy direction.
Transportation: The Mandate Premium Becomes a Valuation Discount
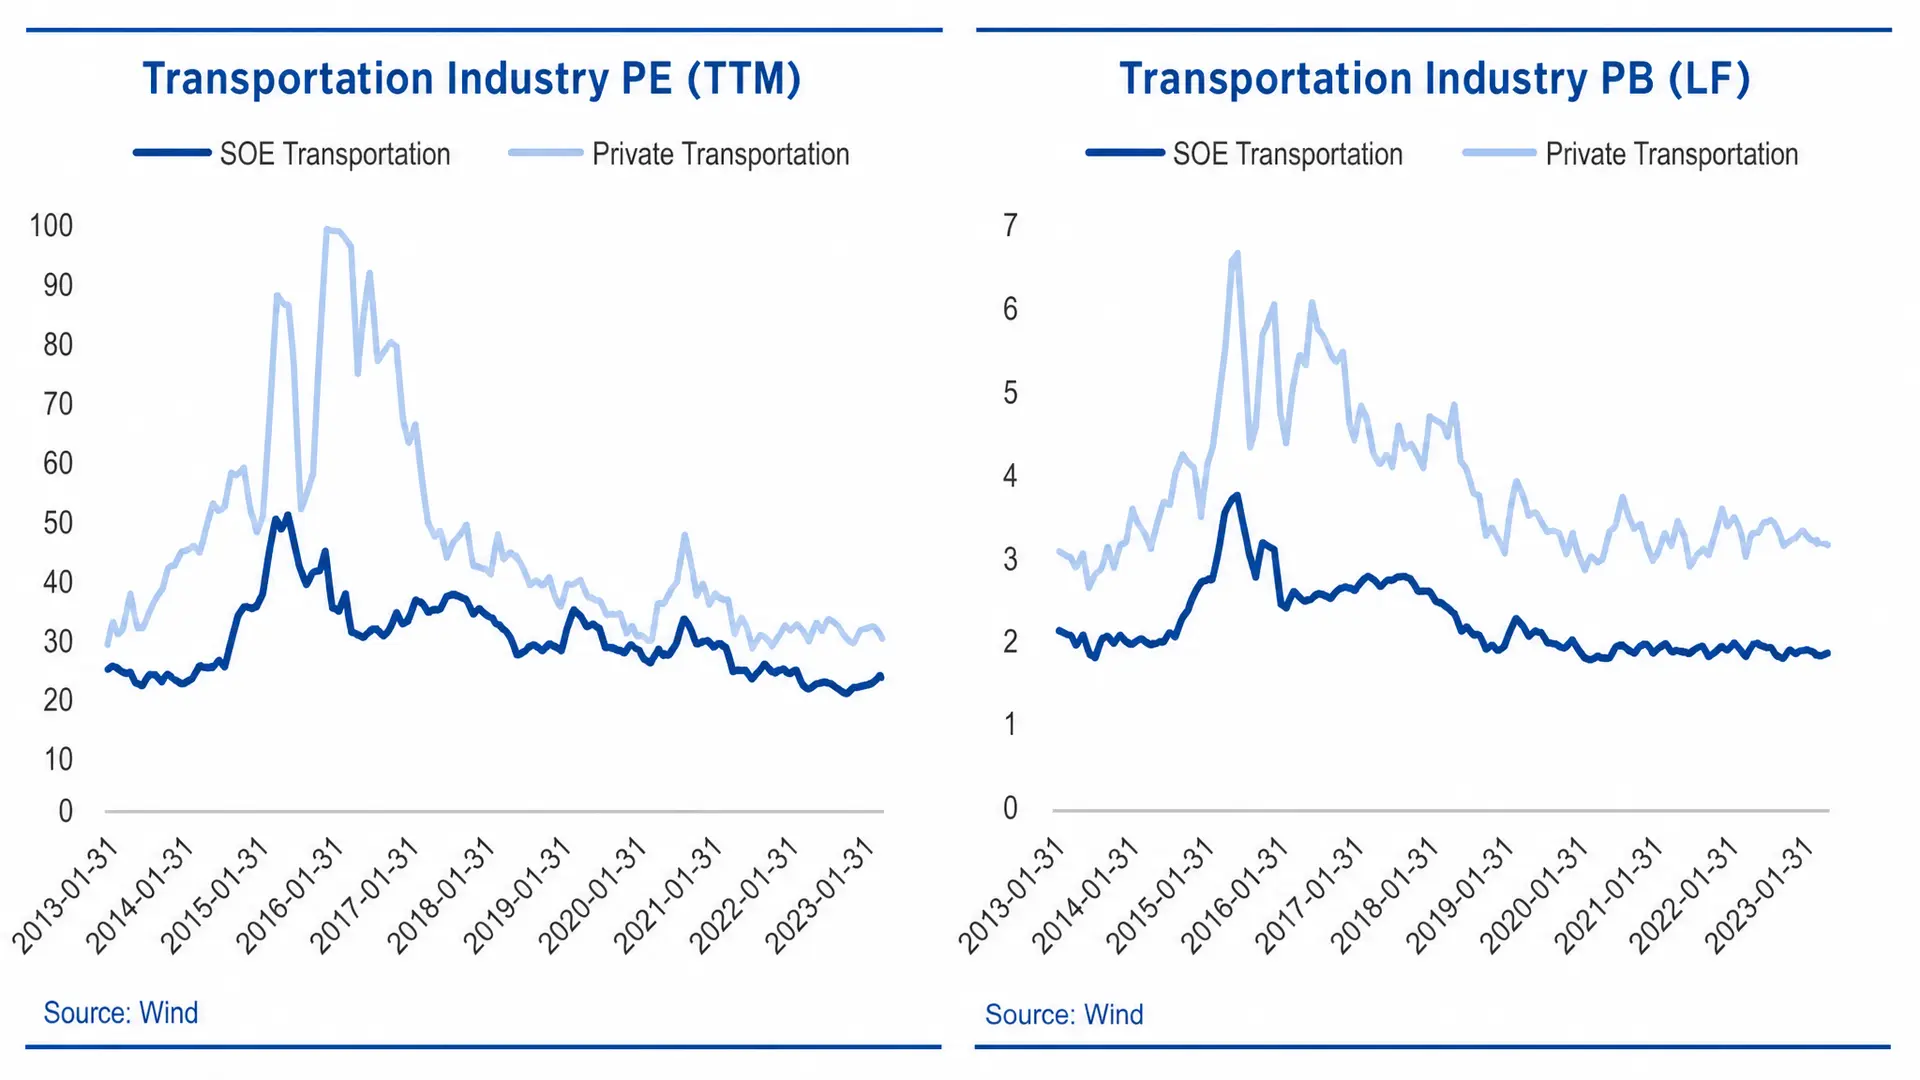
The transportation sector contains some of the most extreme cases in the Chinese SOE universe. State-owned transportation firms operate under explicit obligations to maintain service continuity, capacity, and pricing stability, particularly in shipping, rail, and aviation. These obligations are productive for the broader economy and detrimental to per-share return optimization.
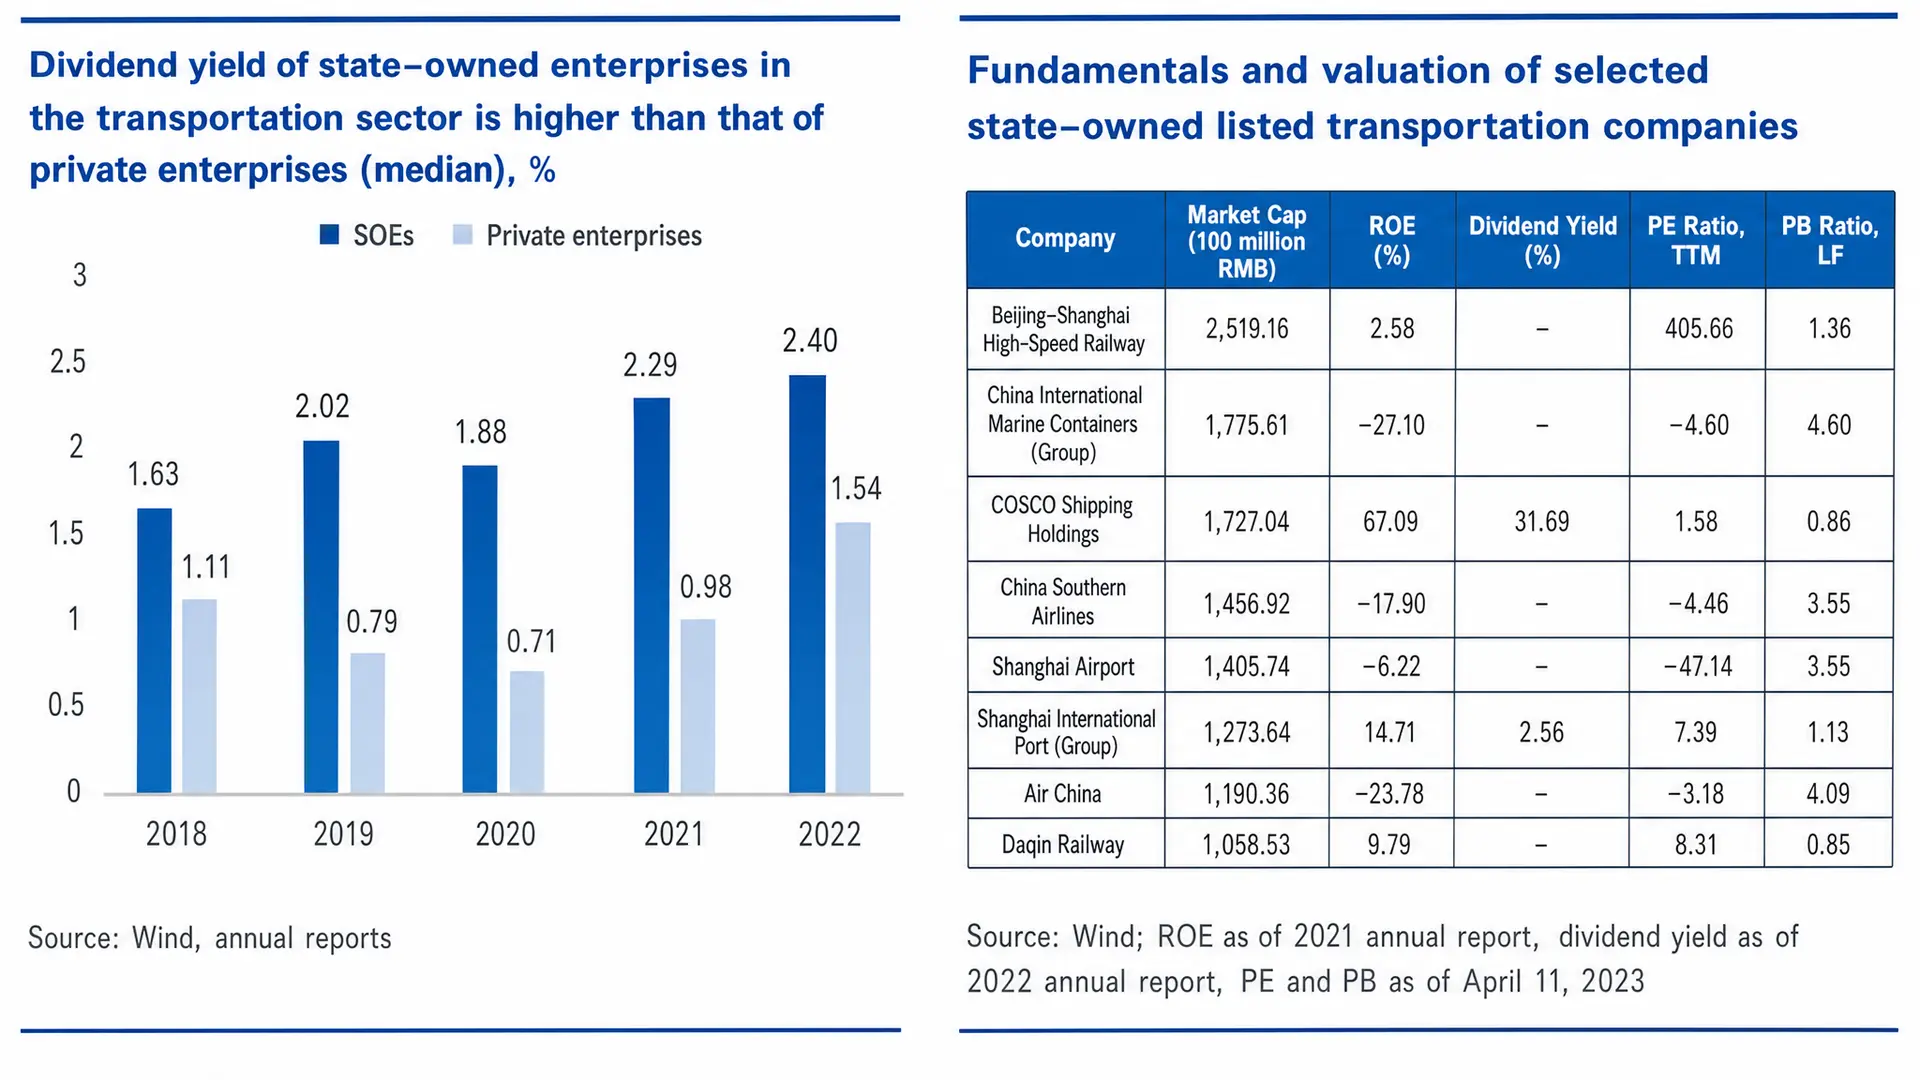
The valuation result is a PB midpoint hovering near 1.0x for the past five years among SOE transportation firms, materially below private peers. Yet dividend yields are systematically higher in the SOE segment. The COSCO Shipping Holdings (601919.SH) case, referenced in Part III, again represents the extreme. The company reported a 2021 ROE of 67.09% and a dividend yield of 31.69%, and traded at a PB of 0.86x as of April 11, 2023. Even allowing for the cyclical peak in container freight rates that drove 2021 earnings, no standard valuation framework explains a sub-1x book multiple on a firm distributing one-third of its market capitalization as dividends in a single year.
What this pricing reveals is that the market discounts not the realized cash flow but the conditional expectation that, under different macro-political circumstances, the firm would be directed to absorb capacity, maintain unprofitable routes, or accept regulated pricing — actions that a private operator would resist and a state operator cannot.
Construction: The Infrastructure Backbone Trades Below Book
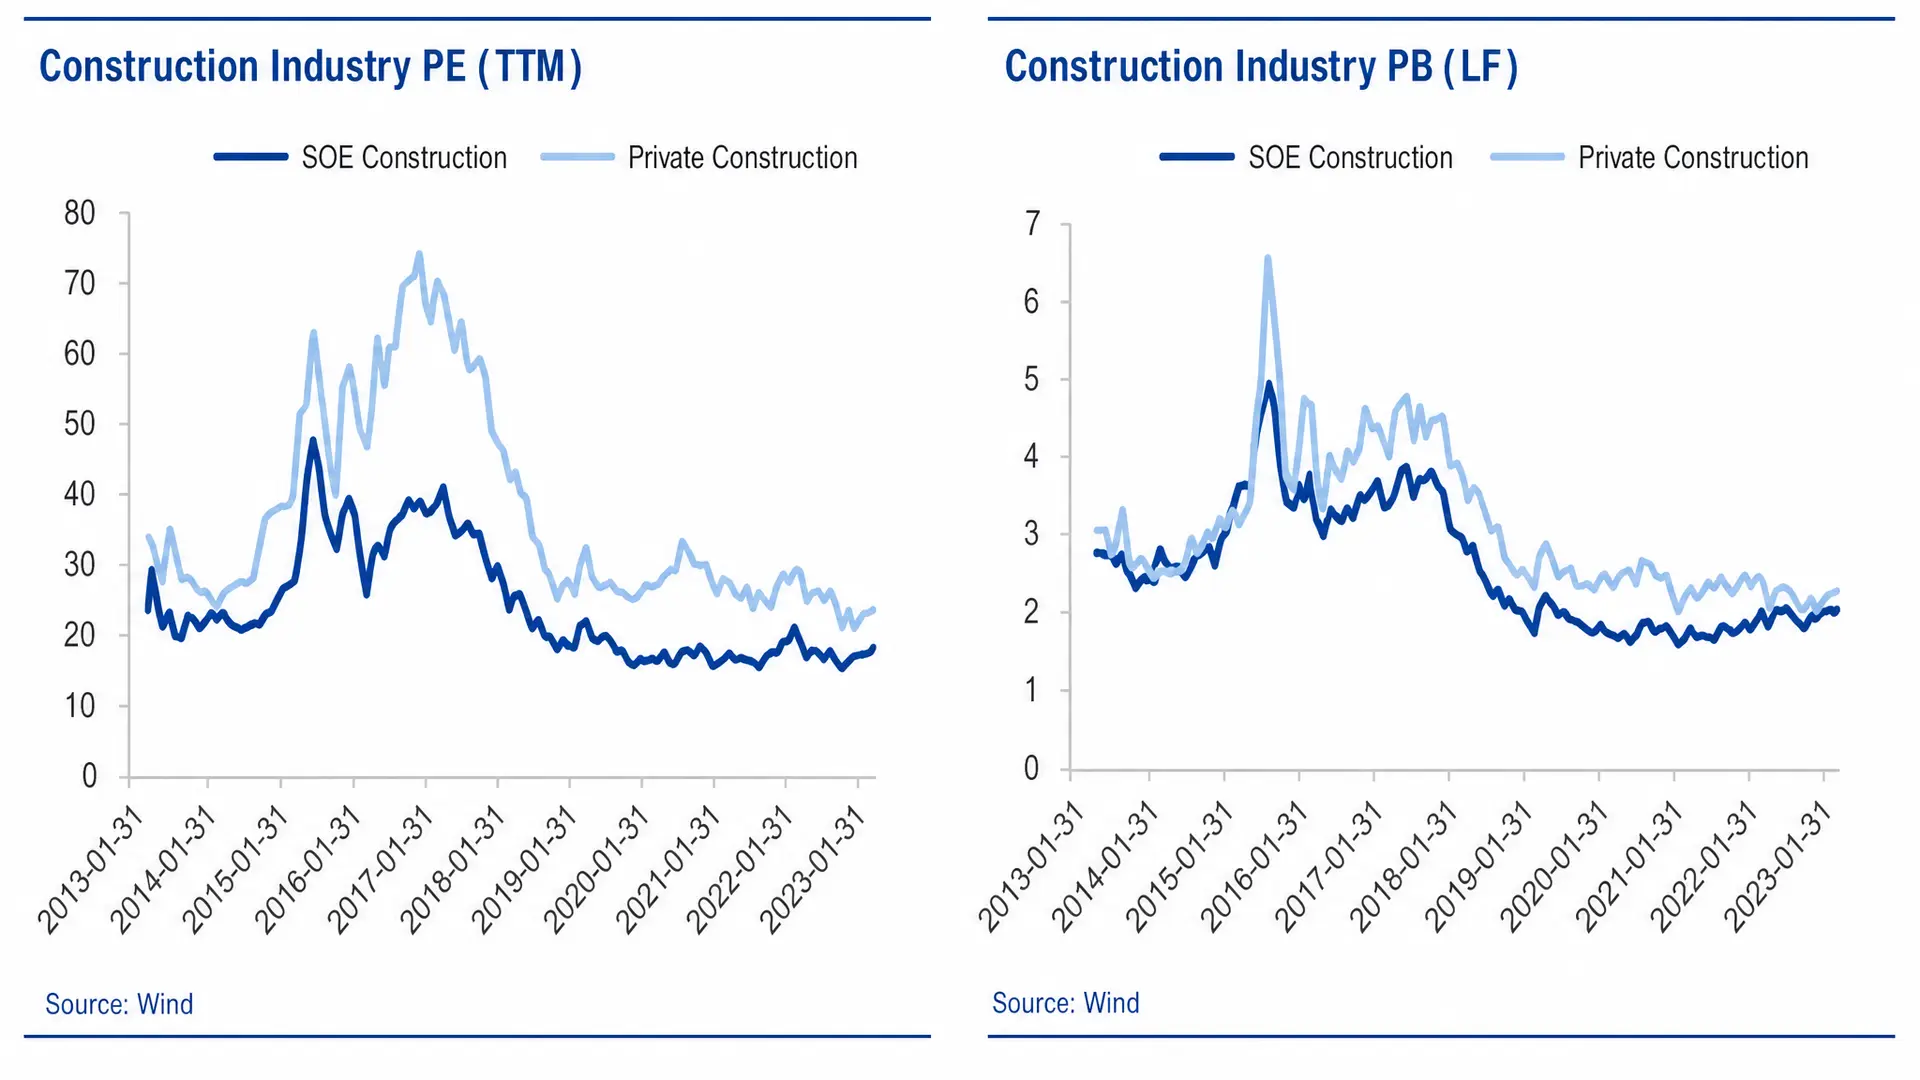
The construction sector is dominated by four central SOEs: China State Construction Engineering (601668.SH), China Railway Group (601390.SH), China Communications Construction, and China Railway Construction. All four trade at PB below 1.0x. The PB midpoint for SOE construction firms has been roughly stable at 1.0x over the past five years, with private-sector construction firms trading meaningfully higher.
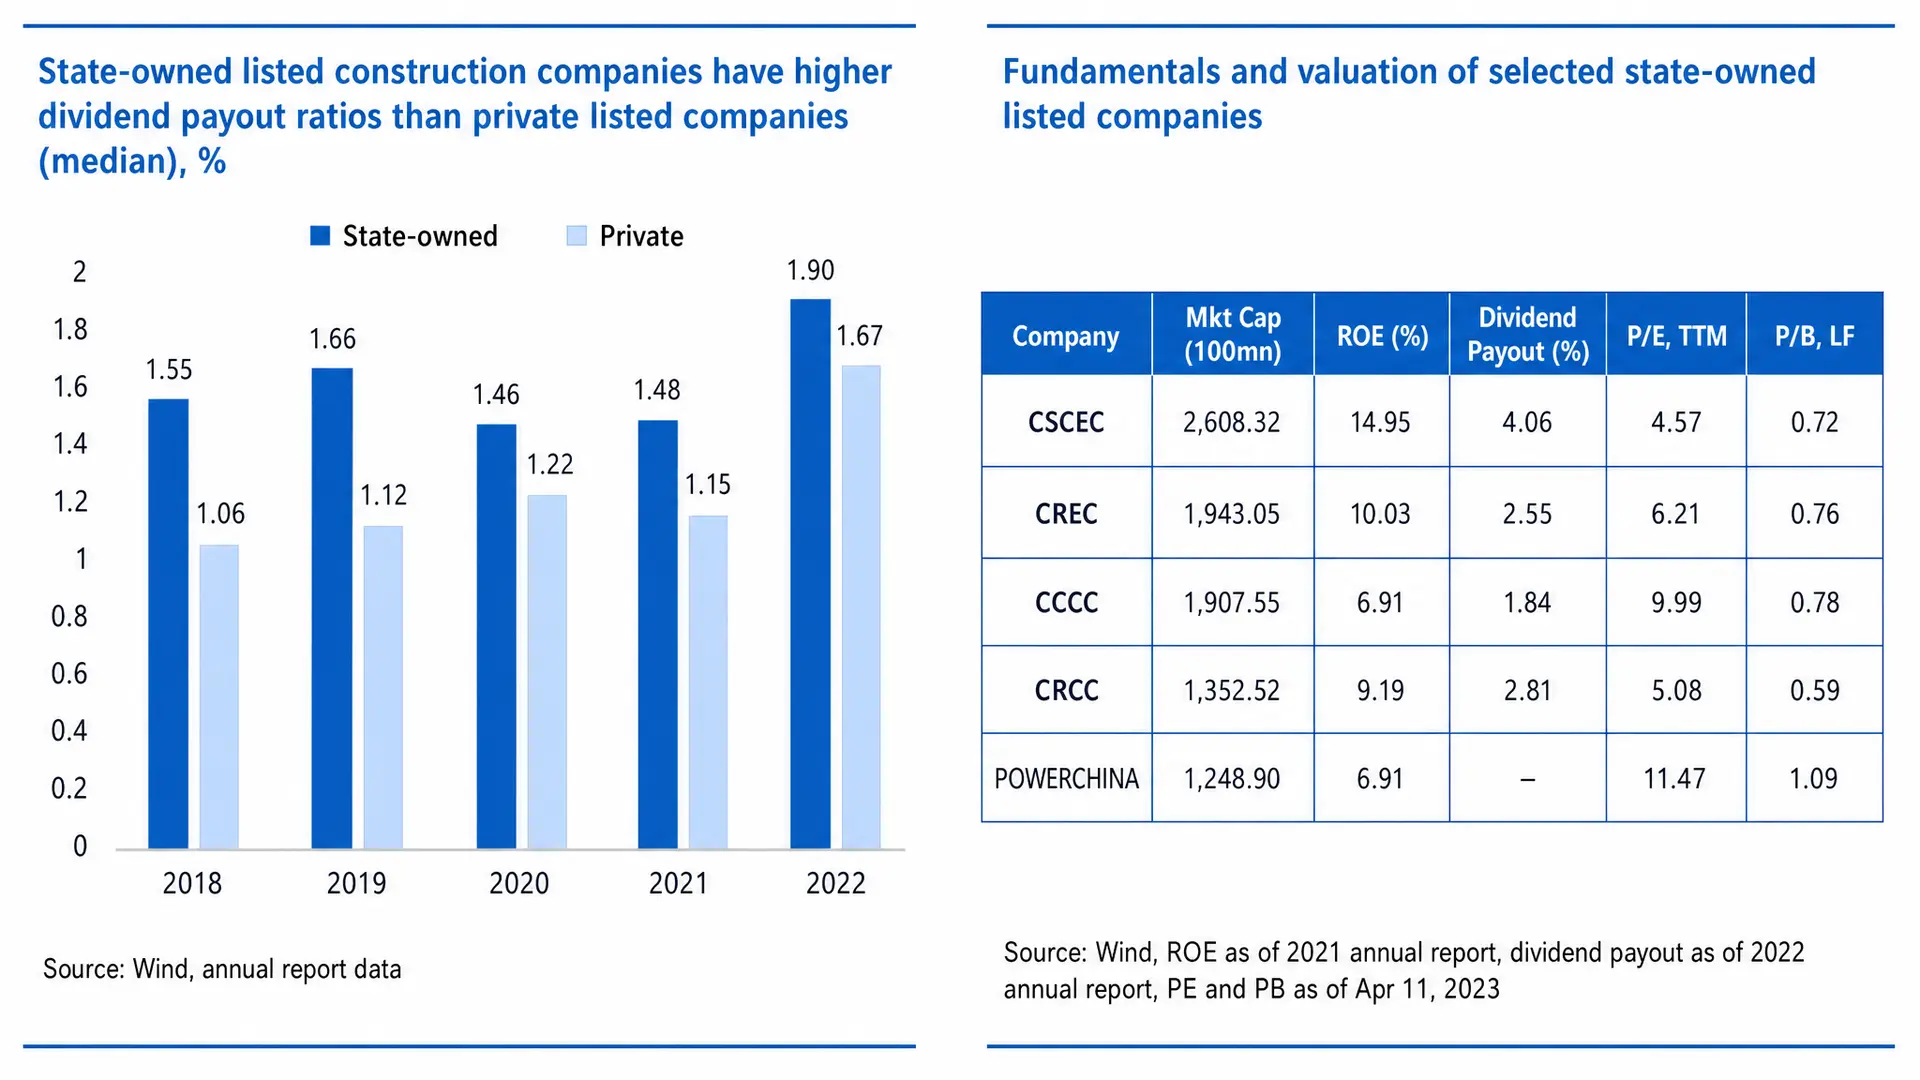
The underlying financials do not support sub-book valuations. China State Construction reported a 2021 ROE of 14.95% and a dividend yield of 4.06%, with a PB of 0.72x. China Railway Group showed ROE of 10.20% and a PB of 0.84x. These are not failing businesses. They are large, profitable, and consistently dividend-paying enterprises that the market refuses to value at book.
The discount in construction reflects two compounding factors. The first is sectoral: Chinese real estate slowdown and the deceleration of fixed-asset investment growth have pressured the entire construction value chain. The second is structural: large central construction SOEs are repeatedly mobilized to deliver national infrastructure projects under the Belt and Road framework and domestic stimulus programs, with returns subordinated to delivery objectives. The market prices this as a permanent claim on capital deployment rather than as a temporary cyclical headwind.
Petrochemicals: The Largest Names Trade Below Book
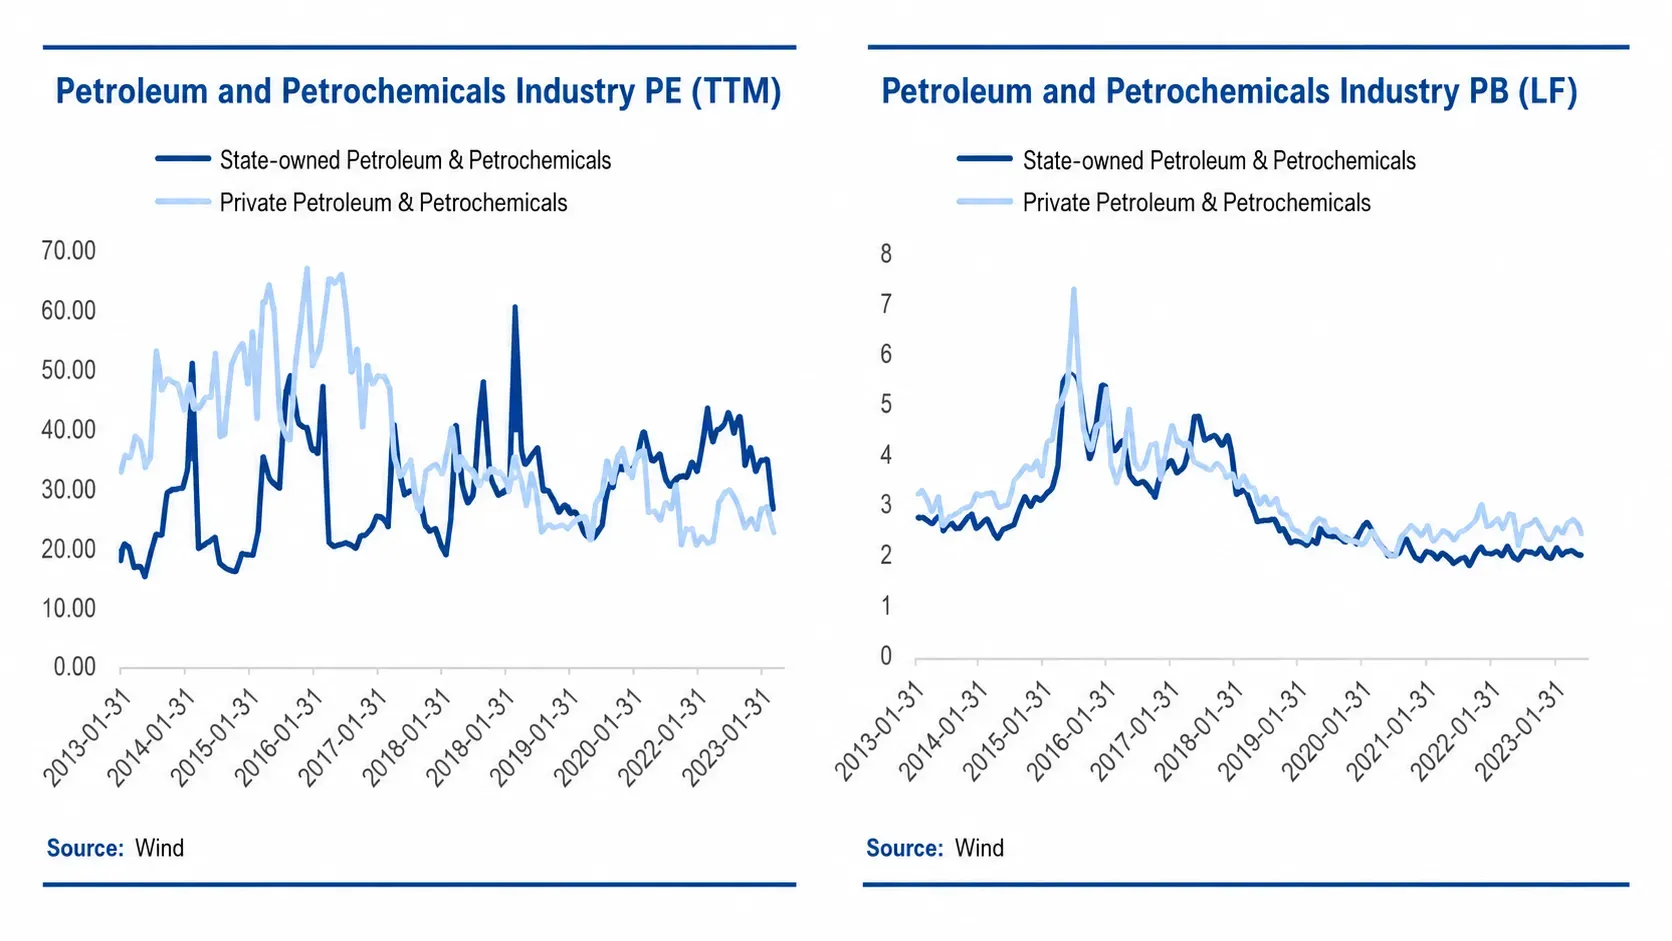
The petrochemical sector presents the most extreme aggregate valuation outcome. The two industry giants — PetroChina (601857.SH) and Sinopec (600028.SH) — both trade at PB below 1.0x despite being among the largest companies by market capitalization in the Chinese equity market.
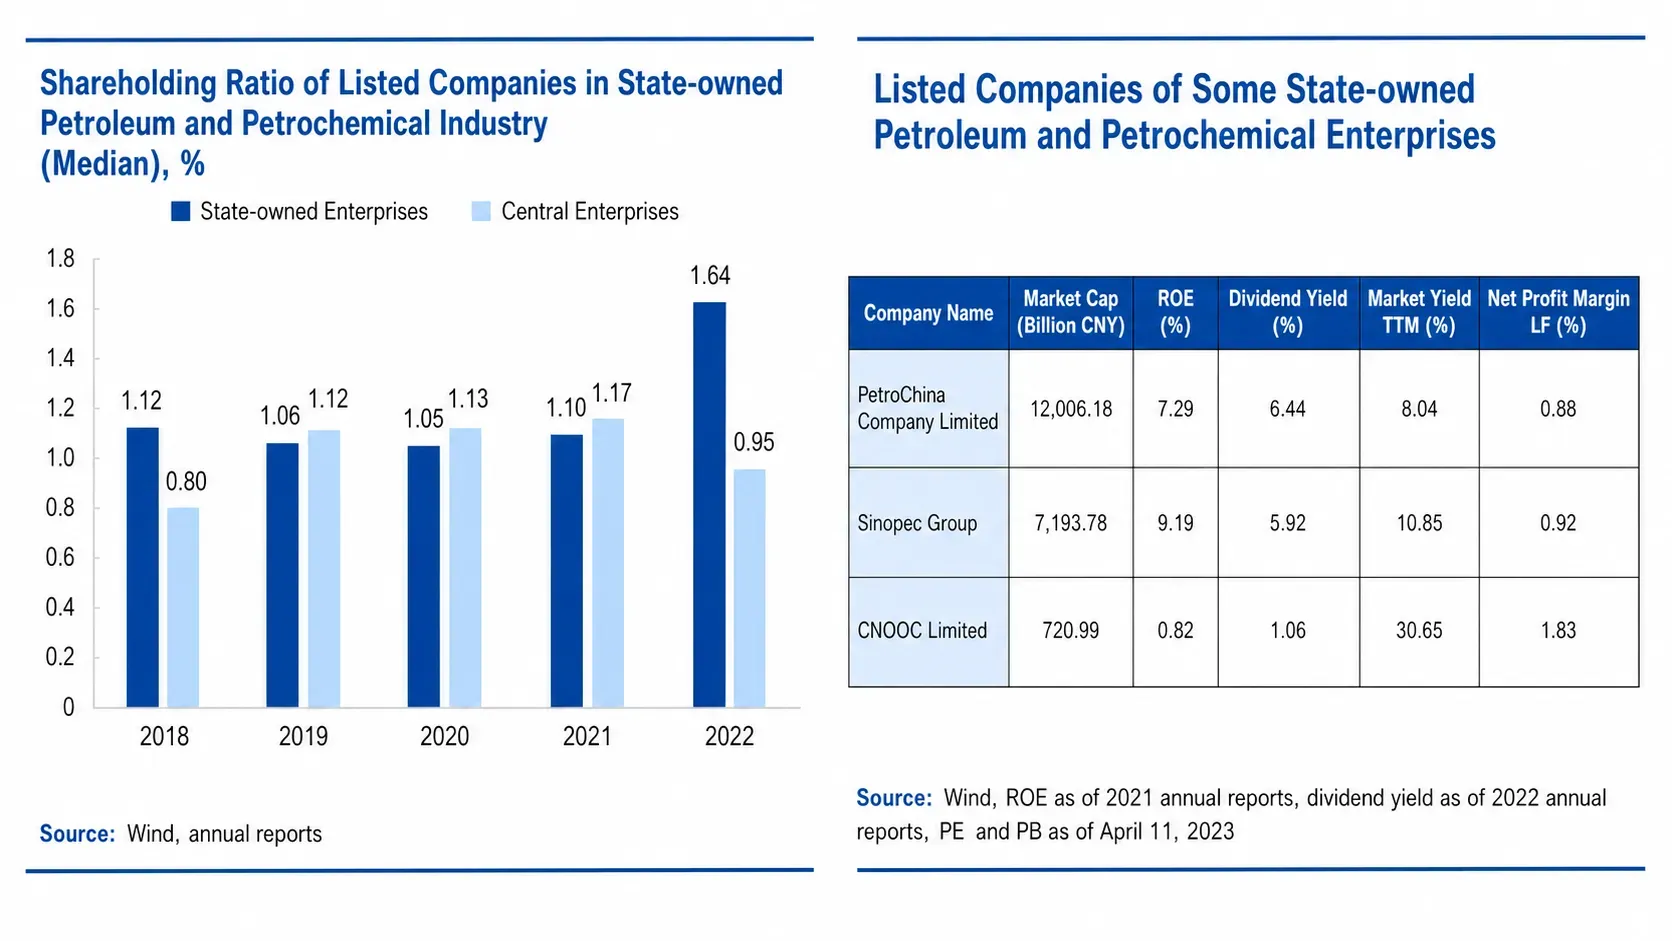
As of April 2023, PetroChina reported a 2021 ROE of 7.29%, a dividend yield of 6.44%, and a PB of 0.88x. Sinopec reported ROE of 9.19%, a yield of 5.92%, and PB of 0.92x. Both companies have explicit roles in national energy security, including obligations to maintain refining capacity, distribution networks, and pricing stability for downstream fuel products. The dividend yields above 6% reflect both strong operational cash generation and the absence of growth-oriented capital deployment outlets — there are few new oilfields to develop and few new refining footprints to build. The PB below book reflects market skepticism that these firms will ever be permitted to maximize per-share returns over national energy mandates.
The Repricing Asymmetry
The industry map reveals something that the aggregate discount obscures. The four industries with the largest discounts are also the four industries where the 2023 "One Profit, Five Ratios" reform framework has the most room to operate. ROE in petrochemicals, steel, construction, and transportation is structurally suppressed by the very policy obligations that create the discount. If the reform framework succeeds even partially in re-orienting management incentives toward ROE and shareholder return — without dismantling the underlying policy mandate — these four industries are where the marginal improvement will be largest.
This produces an asymmetric setup. If reform fails or stalls, the discount persists and investors collect the dividend yields, which are already higher than most North American income alternatives. If reform succeeds materially, ROE expansion in the most discounted industries delivers both earnings growth and multiple expansion. The downside is bounded by the cash yield. The upside is gated by execution of a reform program whose direction is now public and measurable.
This is not a prediction. It is a description of the payoff structure embedded in current pricing. Whether the structure realizes depends on conditions that Part VIII will address explicitly.
What the Industry Map Is Not
The industry map should not be read as a stock-picking guide. It does not identify which specific names will outperform. It identifies where the market's discount mechanism is most active and therefore where reform-driven repricing has the largest mechanical room to operate. The selection of specific securities within these industries requires a second layer of analysis — one that the next installment, Part VI, will introduce through the lens of operating cash flow quality as a forward-looking quality signal that distinguishes SOEs that are likely to translate reform incentives into actual ROE improvement from those that will not.
For North American allocators, the practical takeaway from the industry map is narrower than a buy list and broader than a single name. It is the recognition that within the universe of Chinese central SOEs, the deepest discounts cluster in industries where the gap between cash generation and equity valuation is widest, and where the policy framework now provides a mechanism — however imperfect — for that gap to close.