Discount #03 — The Dividend Paradox: Higher Payouts, Lower Valuations
Conventional wisdom holds that Chinese state-owned enterprises are unreliable dividend payers. The data shows the opposite: central SOEs delivered a 55.17% three-year cumulative payout ratio against 49.59% for private firms — alongside higher ROE and stronger profit resilience.

Here is a question that should not have an easy answer.
Imagine a company that has delivered higher dividend payouts than its peers for a decade. Its return on equity has consistently outpaced the broader market. Its revenue and profit growth held up better than private-sector competitors during the worst economic stress of the past five years. By any conventional discounted cash flow framework, this company should trade at a premium — or at minimum, at par.
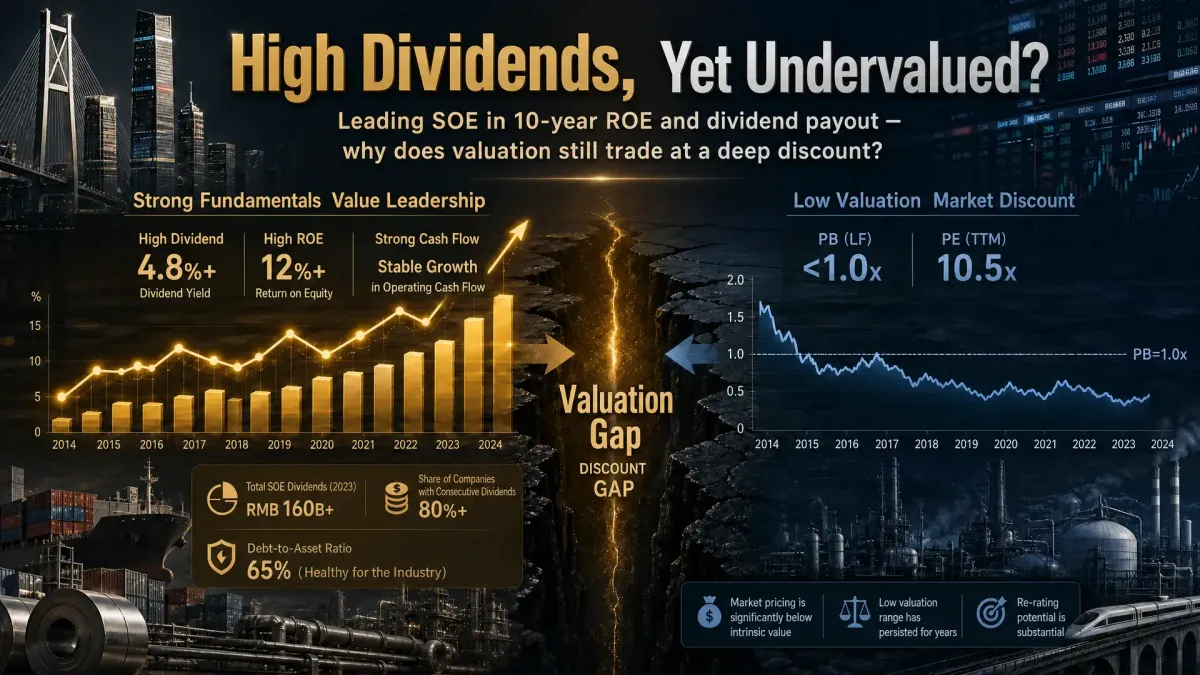
Instead, it trades at a price-to-book ratio below 1.0x.
This is not a hypothetical. It describes the aggregate profile of China's central state-owned enterprises — a market segment that, as of April 2023, carried a PE (TTM) of approximately 10.5x against a private-sector comparable of 39.5x. The first article in this series established the scale of that gap. The second examined the policy framework designed to close it. This article examines the data point that makes the discount most difficult to explain on fundamental grounds: the dividend record.
What the Payout Data Actually Shows
The conventional narrative about Chinese SOEs, particularly among investors based in North America and Europe, runs something like this: state-owned enterprises are capital-inefficient, opaque, and prioritize policy objectives over shareholder returns. Dividends, in this telling, are unreliable — a secondary consideration in enterprises whose primary mandate is to serve state interests rather than generate investor income.
The data does not support this narrative.
As of December 31, 2022, the median cumulative three-year dividend payout ratio for central SOE listed companies stood at 55.17% — meaningfully above the 49.59% recorded for private enterprises and the 46.29% for the broader A-share market. Looking at lifetime payout ratios since listing, central SOEs also lead: 31.31% against 29.64% for private enterprises and 30.77% for the full A-share universe.
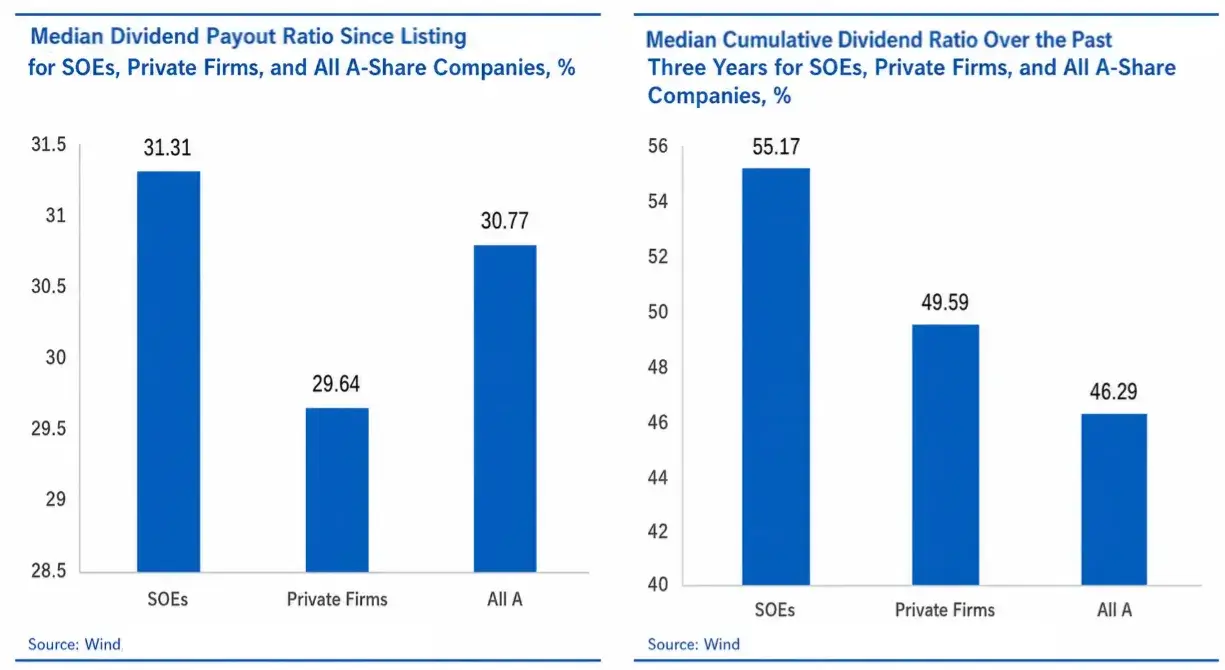
These are not marginal differences. A 550 basis point gap in three-year cumulative payout ratios — in favor of the supposedly shareholder-indifferent SOEs — represents a meaningful and sustained divergence from the narrative that has kept international capital on the sidelines.
The ROE Picture
Dividend data does not exist in isolation. To understand whether the payout levels are sustainable, you need to look at the underlying return on equity that funds them.
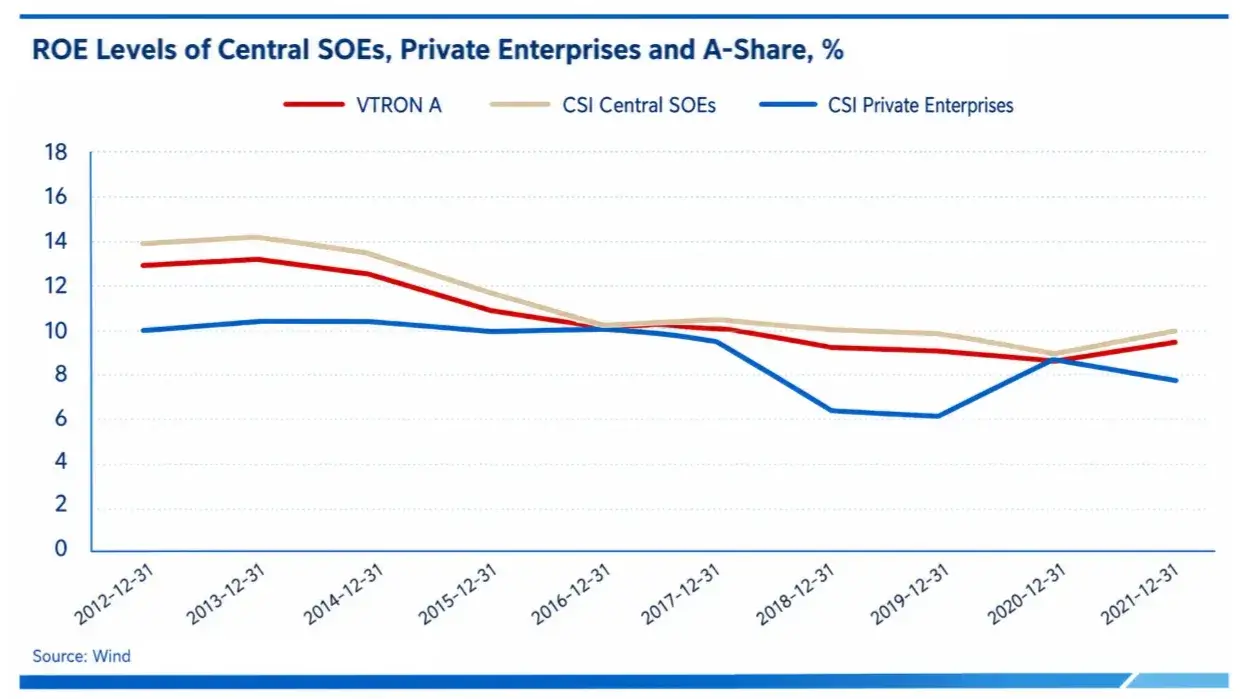
Across the decade from 2012 to 2021, central SOEs maintained a measurable ROE advantage over both private enterprises and the broader A-share market. The advantage narrowed during 2020 — the peak year of pandemic-related economic disruption — but the structural pattern held: central SOEs consistently generated higher returns on equity than their private-sector counterparts, even as their valuations implied the opposite.
The combination of higher ROE and higher dividend payout ratios — sustained over a decade — is precisely the profile that standard equity valuation models are designed to reward with premium pricing. The fact that it has instead produced persistent discount pricing is the central puzzle this series is examining.
A Case Study in Extreme Mispricing
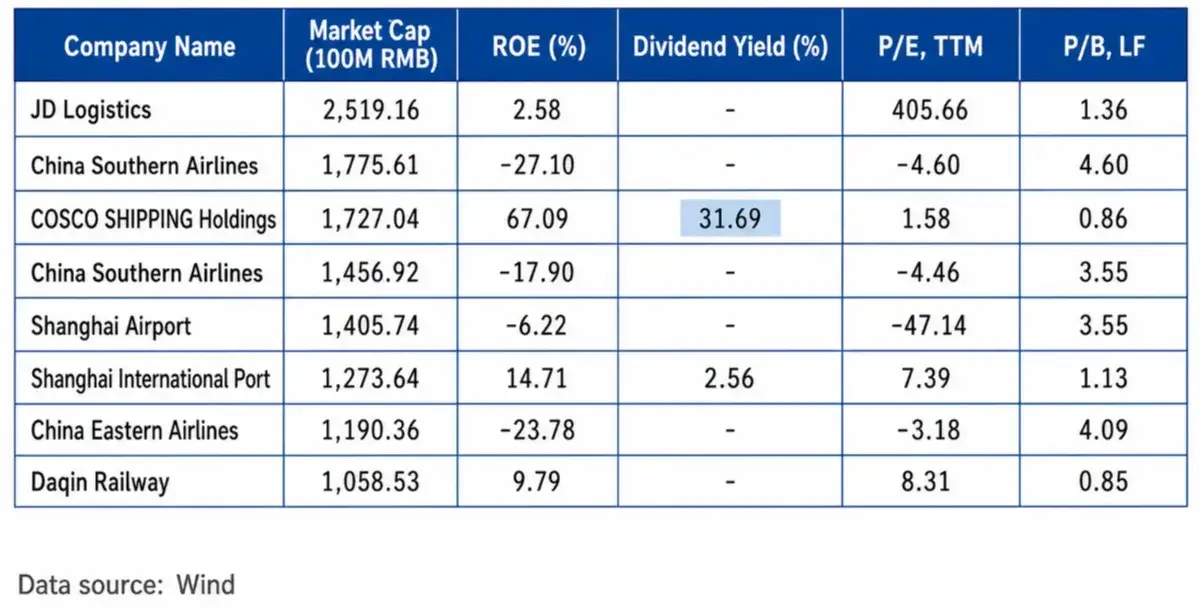
Abstract data becomes concrete when you look at individual companies. Consider COSCO Shipping Holdings (中远海控, 601919.SH), one of the world's largest container shipping operators and a subsidiary of a central SOE group.
In 2021, COSCO Shipping Holdings recorded a return on equity of 67.09%. In the same year, its dividend yield reached 31.69%, reflecting a payout ratio consistent with a company that was generating exceptional cash returns and choosing to distribute them to shareholders.
As of April 11, 2023, COSCO Shipping Holdings traded at a price-to-book ratio of 0.86x.
To put that in context: a company generating 67% returns on equity — a figure that would place it among the top performers in any global index — was being valued at a discount to its book value. Its PE ratio stood at 1.58x. In any mature capital market, an arbitrage opportunity of this magnitude would attract institutional capital within days, compressing the discount to zero.
It did not. The discount persisted.
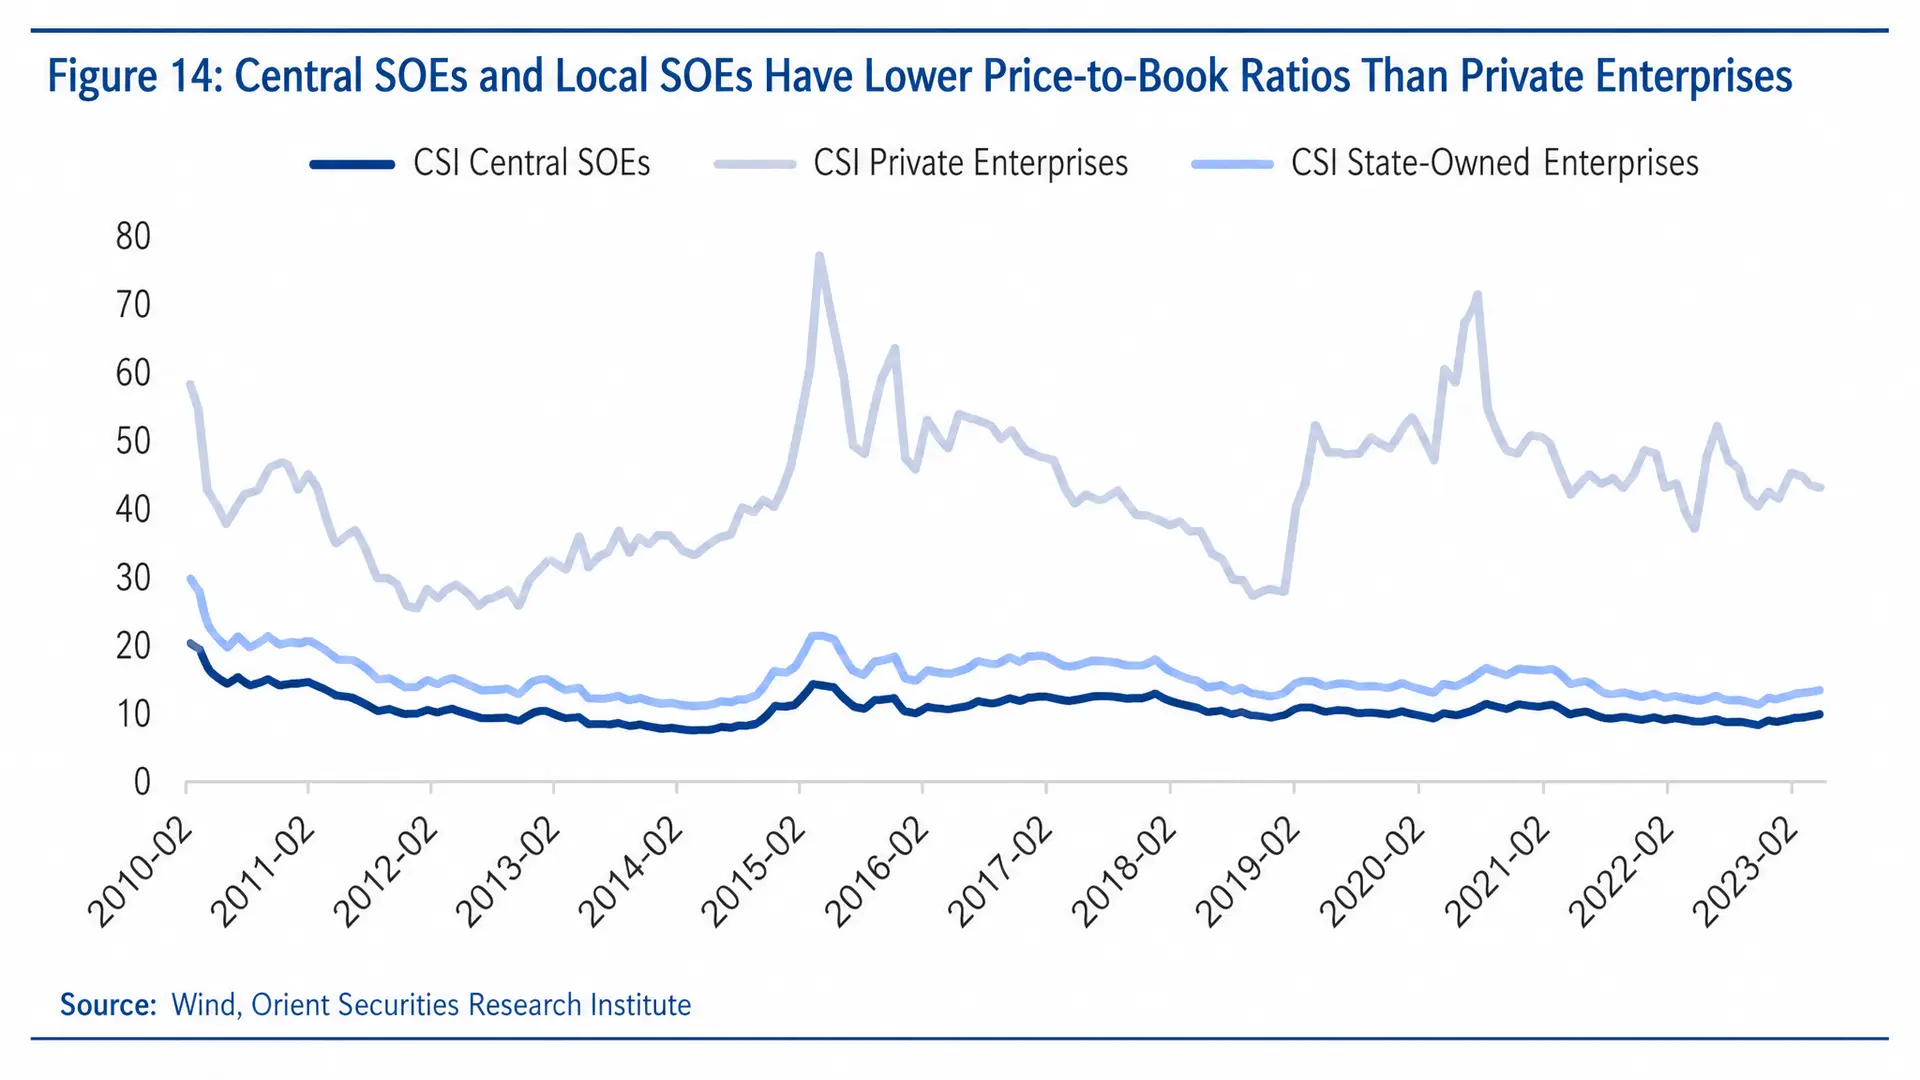
COSCO is an extreme case, but it is not an isolated one. Across the transportation sector, state-owned listed companies have maintained price-to-book ratios centered around 1.0x over the past five years — far below their private-sector counterparts — while simultaneously delivering higher dividend yields. The pattern repeats in steel, construction, and petrochemicals: higher payouts, lower valuations.
Why Higher Dividends Have Not Closed the Gap
The persistence of the discount despite superior dividend and ROE data points to a pricing mechanism that is not responding to fundamentals in the conventional sense. The market is not ignoring the dividend data. It is discounting it — applying a haircut to the value of those dividends that reflects something other than payout capacity.
That something is governance uncertainty. The question is not whether central SOEs can pay dividends. The data shows they can, and they do, at rates above the market median. The question is whether minority shareholders can rely on those dividends continuing — and whether the enterprises will prioritize shareholder returns when policy objectives point in a different direction.
This is the question the 2023 reform framework — the "One Profit, Five Ratios" system examined in the previous article — is designed, at least in part, to answer. By formally tying management evaluation to return on equity and cash flow quality, SASAC has introduced an accountability mechanism that did not previously exist in this form. The intent is to make shareholder-oriented metrics binding on management, not advisory.
Whether that intent translates into measurable outcomes is a different question — and one this series will continue to examine.
The Dividend Signal in Portfolio Context
For investors constructing diversified global portfolios, the dividend data on Chinese central SOEs carries a specific implication that goes beyond the headline yield figures.
Historical return analysis of central SOE listed companies shows that high-dividend-payout portfolios have outperformed over the relevant measurement period — consistently beating mid- and low-payout groups, as well as the CSI 300 and the broader A-share market. This outperformance is not simply a function of yield; it reflects the market's recognition that sustained dividend capacity is a credible signal of underlying cash generation quality.
There is also a secondary signal worth noting. Low-dividend-payout SOE portfolios have outperformed mid-payout portfolios in the same period — a pattern that suggests the market is pricing in an expectation of dividend improvement for companies currently distributing less. In other words, the market is not simply rewarding current yield; it is also pricing the trajectory.
For an investor evaluating Chinese SOEs from outside the domestic market, this suggests a framework: the dividend record is not noise. It is a signal — imperfect, but real — about the quality of cash generation and the direction of management incentives. The discount does not invalidate the signal. It raises the question of what else the market is pricing.
What Comes Next
The dividend data establishes that the discount cannot be explained by payout capacity or ROE performance. Central SOEs, in aggregate, score better on both metrics than their private-sector peers — and have done so consistently over a decade.
That leaves a different explanation: the market is pricing something that does not show up in payout ratios or return metrics. The next article in this series examines what that something is — and why understanding it is the prerequisite for evaluating whether the 2023 reform framework has any chance of changing the pricing equation.
The discount is real. The fundamentals are real. The gap between them is also real — and it has a name.